Make Your Own Spotify Unwrapped

Tis the season - the Spotify Unwrapped season. If you aren't aware, Spotify creates a yearly "recap" of your listening habits and packages it up in a nice and fun slide show/animated doodad only available on your device. It's a cute thing and as someone who both loves music and stats, I look forward to it. If your curious, here's a part of mine:

Earlier this week I knew Spotify Unwrapped was as eminent as Mariah Carey and I pondered building my own report. Of course, a few months ago I swore off building anything Spotify related again. But given that Spotify lets you export your data, in theory, I could build something without using APIs, right?
Getting the Data
The first step was to get my data. This can be done via Spotify's private page. On there you can request your data for the past year, or, your entire lifetime. They warn you that it may take up to 30 days to generate the extended history, but for me it only took one day. Take that with a grain of salt - your results may vary.
Once you get your report, it's a zip file that consists of a set of JSON files:
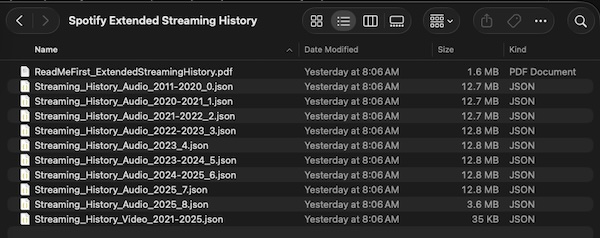
You get a readme that explains the structure, N json files for your audio history and one for video. Honestly I didn't know you could do video on Spotify, but I just ignored that.
If you open up one of the audio files, you'll see an array of track entries. Here's one from this year.
  {
    "ts": "2025-09-18T13:43:56Z",
    "platform": "windows",
    "ms_played": 270186,
    "conn_country": "US",
    "ip_addr": "70.189.36.61",
    "master_metadata_track_name": "Halo",
    "master_metadata_album_artist_name": "Depeche Mode",
    "master_metadata_album_album_name": "Violator (Deluxe)",
    "spotify_track_uri": "spotify:track:6Rr6wXmEx6w6dsBuqqKJa3",
    "episode_name": null,
    "episode_show_name": null,
    "spotify_episode_uri": null,
    "audiobook_title": null,
    "audiobook_uri": null,
    "audiobook_chapter_uri": null,
    "audiobook_chapter_title": null,
    "reason_start": "trackdone",
    "reason_end": "trackdone",
    "shuffle": true,
    "skipped": false,
    "offline": false,
    "offline_timestamp": 1758202112,
    "incognito_mode": false
  },
You get a timestamp, track information, as well as how long you listened to it.
Initial Exploration
I started off with Python. I wanted to scan the files, collect the data, and analyze it. So first, I grab the JSON files, read them in, and append the entries to one big uber array. (As a quick note, in my testing directory, I removed the JSON file related to video stats.)
import glob
import json
# Get all the files. We don't need to sort as the info has timestamps
files = glob.glob('data/*.json')

data = []

for file in files:
  with open(file, 'r') as f:
      content = json.loads(f.read())
      data += content

print(f"Total records loaded: {len(data)}\n")
Cool - now I start analyzing. First, I generate a report of my top artists. I also add the times together to see how long I listened to music:
totalMS = 0

# Group by artist
artist_dict = {}

for record in data:
    artist = record['master_metadata_album_artist_name']
    if artist not in artist_dict:
        artist_dict[artist] = []
    artist_dict[artist].append(record)
    totalMS += record['ms_played']

artist_dict = dict(sorted(artist_dict.items(), key=lambda x: len(x[1]), reverse=True))
artist_keys = artist_dict.keys()
print(f"There are {len(artist_dict)} unique artists.\n")
for x in range(min(20, len(artist_dict))):
    artist = list(artist_keys)[x]
    print(f"Artist: {artist}, Records: {len(artist_dict[artist])}")

print("")
Song info was similar:
# Group by song
song_dict = {}

for record in data:
    song = record['master_metadata_track_name']
    if song not in song_dict:
        song_dict[song] = []
    song_dict[song].append(record)

song_dict = dict(sorted(song_dict.items(), key=lambda x: len(x[1]), reverse=True))
song_keys = song_dict.keys()
for x in range(min(20, len(song_dict))):
    song = list(song_keys)[x]
    print(f"Song: {song}, by {song_dict[song][0]['master_metadata_album_artist_name']} Records: {len(song_dict[song])}")
And finally, I report on the total minutes:
print(f"\nTotal minutes listened: {totalMS / 60000:.2f} minutes")
Here's my report:
Total records loaded: 128932

There are 9844 unique artists.

Artist: Enya, Records: 14814
Artist: Above & Beyond, Records: 3696
Artist: Depeche Mode, Records: 2628
Artist: London Grammar, Records: 2351
Artist: The Cure, Records: 1558
Artist: M83, Records: 834
Artist: Ludwig van Beethoven, Records: 724
Artist: Nine Inch Nails, Records: 714
Artist: Still Corners, Records: 697
Artist: Cocteau Twins, Records: 689
Artist: The xx, Records: 675
Artist: Agnes Obel, Records: 629
Artist: The National, Records: 550
Artist: Duran Duran, Records: 536
Artist: The Sundays, Records: 523
Artist: The Smiths, Records: 520
Artist: The Decemberists, Records: 514
Artist: Johann Sebastian Bach, Records: 510
Artist: Howard Shore, Records: 495
Artist: Beach House, Records: 488

Song: A Day Without Rain, by Enya Records: 414
Song: Only Time, by Enya Records: 406
Song: Caribbean Blue, by Enya Records: 400
Song: Aníron, by Enya Records: 397
Song: The Humming, by Enya Records: 395
Song: Wild Child, by Enya Records: 385
Song: May It Be, by Enya Records: 384
Song: Lothlórien, by Enya Records: 379
Song: The Council of Elrond (feat. "Aniron") [Theme for Aragorn and Arwen], by Howard Shore Records: 372
Song: So I Could Find My Way, by Enya Records: 363
Song: Pale Grass Blue, by Enya Records: 362
Song: One by One, by Enya Records: 362
Song: Fallen Embers, by Enya Records: 361
Song: Book of Days, by Enya Records: 358
Song: Solace, by Croquet Club Records: 354
Song: Echoes in Rain, by Enya Records: 353
Song: Amarantine, by Enya Records: 352
Song: Flora's Secret, by Enya Records: 345
Song: Remember Your Smile, by Enya Records: 339
Song: Dark Sky Island, by Enya Records: 337

Total minutes listened: 469014.35 minutes
If you're curious, that total time in minutes is near eight thousand hours and over three hundred and twenty-five days. That's a lot of music!
The Enya Problem
I love Enya. I have for a very long time. I remember picking up "The Celts" in... Walmart I think, when I was probably 12 or so. She's also the richest female musical artist in England and Ireland.

Her music is incredibly soothing at times, and as someone who has a crap-ton of anxiety on a good day, I need relaxation music. For about two years or so I'd also play Enya when going to bed, which means that for 6 hours, I had Enya playing each and every night. Therefore, she kinda stands out in my stats. Every single one of my top tracks is from her. It's accurate. That being said, I was tempted to write a filter just for her, but decided against it to keep it simple.
Building the Web App
I decided to build a simple web app for this data and for that, I wanted to use Astro. At work, we support Astro in multiple ways so I've been looking for excuses to build out Astro apps as way to get more familiar with the framework. Before I continue, I will say that at the end, I feel like Astro was overkill for what I did, and I'll talk about how I'd build this "for real" later on, but I didn't mind using Astro and getting more practice with it. (And again, Astro is pretty dang cool, you should absolutely check it out!)
I scaffolded a basic Astro app (npm create astro@latest) and focused on two aspects. The first was a page that would generate a JSON file from my directory of files. This was rather simple:
const files = Object.values(import.meta.glob('@data/*.json', { eager: true }));

let allTracks = [];
for(const f in files) {
    let data = files[f].default;
    allTracks = allTracks.concat(data);
}

export function GET() {
    return new Response(JSON.stringify(allTracks), {
    headers: {
        'content-type': 'application/json'
    },
    });
};
This was named data.json.js, but serves up in Astro (and when built) as data.json.
Next, I edited index.html. One of the first things I added was Shoelace, a nice set of web components for a snazzy UI. But honesty, I don't think I used one bit of it so it's a bit of a waste, but as this was just for fun, I haven't yanked it out. Primarily, my index page has a bit of HTML, and a lot of JavaScript. First, the HTML:
<h1>Spotify Data V1</h1>

<div id="loading"></div>
<div id="summary">
</div>
<div class="topStuff">
    <div>
        <h2>Top Artists</h2>
        <div id="topArtists"></div>
    </div>
    <div>
        <h2>Top Tracks</h2>
        <div id="topTracks"></div>
    </div>
</div>
And then, a crap ton of JavaScript. The JavaScript:
- loads in my
data.json - sorts it by date
- creates a summary report
- created two tables of tracks and artists
Here's that work:
document.addEventListener('DOMContentLoaded', init, false);
let $loading, $summary, $topArtists, $topTracks;

async function init() {
    $loading = document.querySelector('#loading');
    $summary = document.querySelector('#summary');
    $topArtists = document.querySelector('#topArtists');
    $topTracks = document.querySelector('#topTracks');

    console.log('init');
    $loading.innerHTML = "Loading data...";

    let req = await fetch('./data.json');
    let data = await req.json();
    data = data.sort((a,b) => {
        return new Date(a) - new Date(b);
    });

    let totalTime = data.reduce((acc, x) => {
        return acc + x['ms_played']
    },0);
    let hours = Math.floor(totalTime / 1000 / 60 / 60);

    $loading.innerHTML = "";

    // render summary while we work on other stuff
    $summary.innerHTML = `
<p>
Data consists of ${numberFormat(data.length)} total tracks. The first track was recorded
${dateFormat(data[0].ts)} and the last track was recorded ${dateFormat(data[data.length-1].ts)}.
You've listened for a total of ${numberFormat(hours)} hours.
</p>
    `;

    let topArtists = getTopArtists(data);
    let topA = `
    <table>
        <thead>
            <tr>
                <td>Name</td>
                <td>Tracks</td>
            </tr>
        </thead>
        <tbody>
    `;
    for(let i=0;i < Math.min(20, topArtists.length); i++) {
        topA += `
        <tr><td>${topArtists[i].name}</td><td>${numberFormat(topArtists[i].count)}</td></tr>
        `;
    }

    topA += '</tbody></table>';
    $topArtists.innerHTML = topA;

    let topTracks = getTopTracks(data);
    let topT = `
    <table>
        <thead>
            <tr>
                <td>Name</td>
                <td>Listens</td>
            </tr>
        </thead>
        <tbody>
    `;
    for(let i=0;i < Math.min(20, topTracks.length); i++) {
        topT += `
        <tr><td>${topTracks[i].name}</td><td>${numberFormat(topTracks[i].count)}</td></tr>
        `;
    }

    topT += '</tbody></table>';
    $topTracks.innerHTML = topT;

}

function getTopArtists(data) {
    let artists = {};
    for(let a of data) {
        if(!artists[a['master_metadata_album_artist_name']]) {
            artists[a['master_metadata_album_artist_name']] = 0;
        }
        artists[a['master_metadata_album_artist_name']] += 1;
    }

    // convert to array
    let artistsArr = [];
    for(let a in artists) artistsArr.push({name:a, count:artists[a]});

    return artistsArr.sort((a, b) => {
        return b.count - a.count;
    });
}

function getTopTracks(data) {
    let tracks = {};
    for(let a of data) {
        if(!tracks[a['master_metadata_track_name']]) {
            tracks[a['master_metadata_track_name']] = 0;
        }
        tracks[a['master_metadata_track_name']] += 1;
    }

    // convert to array
    let tracksArr = [];
    for(let t in tracks) tracksArr.push({name:t, count:tracks[t]});

    return tracksArr.sort((a, b) => {
        return b.count - a.count;
    });
}

function numberFormat(x) {
    return new Intl.NumberFormat().format(x);
}

function dateFormat(x) {
    return new Intl.DateTimeFormat(navigator.language, {
        year: 'numeric',
        month: 'long',
        day: 'numeric',
        hour: 'numeric',
        minute: 'numeric',
        second: 'numeric',
    }).format(new Date(x));
}
I know I mentioned earlier that I probably should not have used Astro for this, and here's a prime example. This is parsing and reporting the data, and nothing more. I could do this entirely server-side in Astro and simplify the final result. I figure part of learning a tool is recognizing when you aren't using it as best you could, and that's good, right?
Here's how this looks:
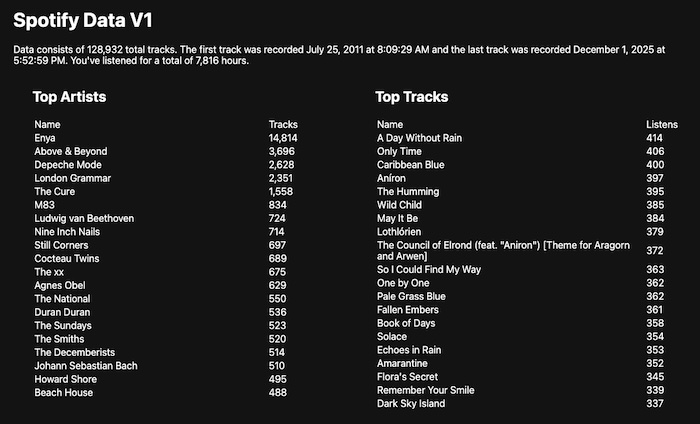
Pretty vanilla, and honestly, could use some more fun stuff, like charts and other things, but instead, I copied this file over to a new page, indexv2.astro and added something else - date filtering. First in the HTML I added two date fields:
<div style="display:none" id="dateFilters">
    Filter results from <input type="date" id="fromDate"> to <input type="date" id="toDate">.
    <div class="topStuff">
        <div>
            <h2>Top Artists</h2>
            <div id="topArtists"></div>
        </div>
        <div>
            <h2>Top Tracks</h2>
            <div id="topTracks"></div>
        </div>
    </div>
</div>
I then re-engineered my JavaScript to handle noticing changes to the filters and re-rendering the results:
document.addEventListener('DOMContentLoaded', init, false);
let $loading, $summary, $topArtists, $topTracks, $fromDate, $toDate;
let data;

async function init() {
    $loading = document.querySelector('#loading');
    $summary = document.querySelector('#summary');
    $topArtists = document.querySelector('#topArtists');
    $topTracks = document.querySelector('#topTracks');
    $fromDate = document.querySelector('#fromDate');
    $toDate = document.querySelector('#toDate');

    $loading.innerHTML = "Loading data...";

    let req = await fetch('./data.json');
    data = await req.json();
    data = data.sort((a,b) => {
        return new Date(a) - new Date(b);
    });

    $loading.innerHTML = "";
    document.querySelector('#dateFilters').style.display = 'block';

    renderStats();

    $fromDate.addEventListener('change', renderStats);
    $toDate.addEventListener('change', renderStats);

}

async function renderStats() {

    let d = data;
    // filter by date range
    if($fromDate.value) {
        console.log('filtering to after', $fromDate.value);
        d = d.filter(x => new Date(x.ts) >= new Date($fromDate.value));
    }

    if($toDate.value) {
        console.log('filtering to before', $toDate.value);
        d = d.filter(x => new Date(x.ts) <= new Date($toDate.value));
    }


    let totalTime = d.reduce((acc, x) => {
        return acc + x['ms_played']
    },0);
    let hours = Math.floor(totalTime / 1000 / 60 / 60);

    // render summary while we work on other stuff
    $summary.innerHTML = `
<p>
Data consists of ${numberFormat(d.length)} total tracks. The first track was recorded
${dateFormat(d[0].ts)} and the last track was recorded ${dateFormat(d[d.length-1].ts)}.
You've listened for a total of ${numberFormat(hours)} hours.
</p>
    `;

    let topArtists = getTopArtists(d);
    let topA = `
    <table>
        <thead>
            <tr>
                <td>Name</td>
                <td>Tracks</td>
            </tr>
        </thead>
        <tbody>
    `;
    for(let i=0;i < Math.min(20, topArtists.length); i++) {
        topA += `
        <tr><td>${topArtists[i].name}</td><td>${numberFormat(topArtists[i].count)}</td></tr>
        `;
    }

    topA += '</tbody></table>';
    $topArtists.innerHTML = topA;

    let topTracks = getTopTracks(d);
    let topT = `
    <table>
        <thead>
            <tr>
                <td>Name</td>
                <td>Listens</td>
            </tr>
        </thead>
        <tbody>
    `;
    for(let i=0;i < Math.min(20, topTracks.length); i++) {
        topT += `
        <tr><td>${topTracks[i].name} (${topTracks[i].artist})</td><td>${numberFormat(topTracks[i].count)}</td></tr>
        `;
    }

    topT += '</tbody></table>';
    $topTracks.innerHTML = topT;

}

function getTopArtists(data) {
    let artists = {};
    for(let a of data) {
        if(!artists[a['master_metadata_album_artist_name']]) {
            artists[a['master_metadata_album_artist_name']] = 0;
        }
        artists[a['master_metadata_album_artist_name']] += 1;
    }

    // convert to array
    let artistsArr = [];
    for(let a in artists) artistsArr.push({name:a, count:artists[a]});

    return artistsArr.sort((a, b) => {
        return b.count - a.count;
    });
}

function getTopTracks(data) {
    let tracks = {};
    for(let a of data) {
        if(!tracks[a['master_metadata_track_name']]) {
            tracks[a['master_metadata_track_name']] = { count:0, artist: a['master_metadata_album_artist_name']};
        }
        tracks[a['master_metadata_track_name']].count += 1;
    }

    // convert to array
    let tracksArr = [];
    for(let t in tracks) tracksArr.push({name:t, count:tracks[t].count, artist: tracks[t].artist});

    return tracksArr.sort((a, b) => {
        return b.count - a.count;
    });
}

function numberFormat(x) {
    return new Intl.NumberFormat().format(x);
}

function dateFormat(x) {
    return new Intl.DateTimeFormat(navigator.language, {
        year: 'numeric',
        month: 'long',
        day: 'numeric',
        hour: 'numeric',
        minute: 'numeric',
        second: 'numeric',
    }).format(new Date(x));
}
Here's a screenshot showing a filter to this year - and Enya's still there of course.
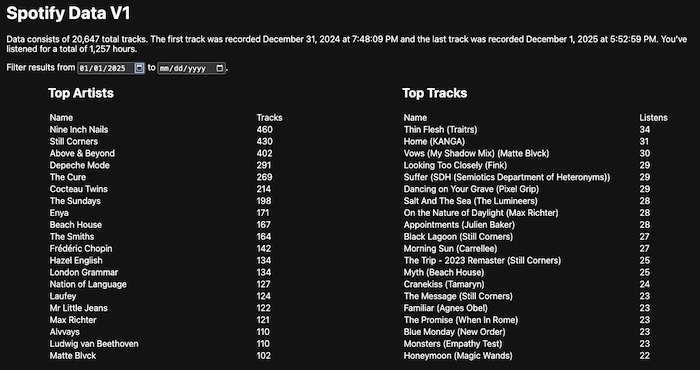
FYI, the "v1" in the layout is intentional, I'll talk more about that at the end. I've shared the source code for this here: https://github.com/cfjedimaster/astro-tests/tree/main/spotifydata1. I did not include my JSON files, but in theory, you could get your own export, unzip them to the data folder, and go to town.
Final Considerations
So as I said, this was not a great use of Astro. All of this could have been done in a vanilla JavaScript app with one file. I could have even added support for drag and drop of the Spotify zip file. There's multiple JavaScript zip parsers including jszip. I do think Astro would make sense if I had done my parsing and such within the server-side and just exported it out with the final results, of course that would support dynamic date filtering so... yeah. There's probably a hundred different ways I could parse this.
Finally, the "v1" part was intentional. The nice thing about this demo is that it absolutely does not rely on Spotify APIs. That being said, I'm working on a new version that does make use of them, at least once, to help enhance the data. I'll try to share that this week but it will probably slip into next week.
Let me know what you think and leave me a comment below!