Using the Google Analytics Embed API to Build a Dashboard
About a year and a half ago I created a demo (Proof of Concept – Dashboard for Google Analytics) of a Google Analytics Dashboard. This demo was entirely client-side based and made use of the API libraries Google created. For the most part, the process was fairly simple. After I figured out how to authenticate the user and query the data, I spent more time making it look pretty than actually working with the API, which is a good thing. More recently I discovered the new Analytics Embed API. The cool thing about the Embed API is that it greatly simplifies the authentication/authorization aspect of getting analytics data and even provides built in charting capabilities. I blogged an example (Quick example of the Google Analytics Embed API) and I thought it might be fun to revisit my dashboard concept using this simpler API.
Before I show the code behind this demo, let me share a screen shot so you can see it in action. I switched to a new charting library for this demo (ChartJS) mainly because Google used it themselves in one of their demos. I didn't spend much time making this pretty - I was going for 'quick impact' in terms of visuals. Obviously though it could be better.
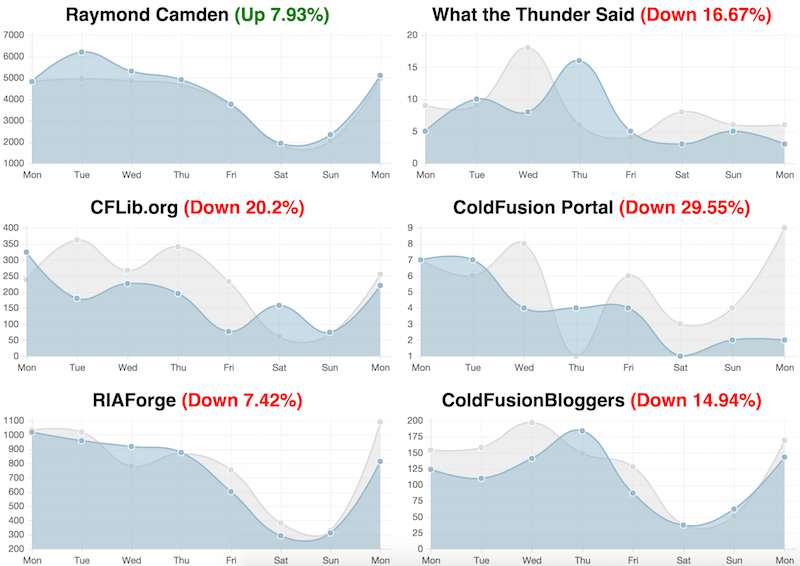
Each chart represents one of my properties. Each line represents page views per days, with the darker blue being the most recent page seven days and the lighter gray being the seven days before that.
The code is made up of several parts. The authentication, as I said, is handled almost entirely by the embed API.
gapi.analytics.ready(function() {

  var CLIENT_ID = '818125206534-g1r0datdtu9serq2pf9cp5vkuih3h8pv.apps.googleusercontent.com';

  gapi.analytics.auth.authorize({
    container: 'auth-button',
    clientid: CLIENT_ID,
    userInfoLabel:""
  });

  gapi.analytics.auth.on('success', function(response) {
    //hide the auth-button
    document.querySelector("#auth-button").style.display='none';
    console.log("get profiles");
    getProfiles(function(profs) {
      window.profiles = profs;
      processProfiles();
    });

  });

  Chart.defaults.global.animationSteps = 60;
  Chart.defaults.global.animationEasing = 'easeInOutQuart';
  Chart.defaults.global.responsive = true;
  Chart.defaults.global.maintainAspectRatio = false;

});
In order to get profiles for my account, I make use of a management API. getProfiles handles fetching, and caching, this result. (I use caching as I had planned, still plan on, adding a few additional filtering options to the report.)
function getProfiles(cb) {
  //do we have a cached version?
  if(sessionStorage["gaProfiles"]) {
    console.log("profiles fetched from cache");
    cb(JSON.parse(sessionStorage["gaProfiles"]));
    return;
  }

  gapi.client.analytics.management.accounts.list().then(function(res) {
    var accountId = res.result.items[0].id;
    var profiles = [];
    gapi.client.analytics.management.webproperties.list({'accountId': accountId}).then(function(res) {

    	res.result.items.forEach(function(item) {
    		if(item.defaultProfileId) profiles.push({id:"ga:"+item.defaultProfileId,name:item.name});
    	});
      sessionStorage["gaProfiles"] = JSON.stringify(profiles);
      cb(profiles);
    });
  });
}
Note that I do not make use of promises in this block and that's a mistake. I make use of it a bit later in another function so I need (well, I want) to be consistent. Now for the fun part. For all of my properties, I need to fetch data for each site. I was able to rip code from one of Google's demos but I quickly ran into rate limit issues. To get around this, I single thread the calls and add a slight delay.
//Credit: https://ga-dev-tools.appspot.com/embed-api/third-party-visualizations/
function query(params) {
  return new Promise(function(resolve, reject) {
    var data = new gapi.analytics.report.Data({query: params});
    data.once('success', function(response) { resolve(response); })
        .once('error', function(response) { reject(response); })
        .execute();
  });
}

function makeCanvas(id) {
  var container = document.getElementById(id);
  var canvas = document.createElement('canvas');
  var ctx = canvas.getContext('2d');

  container.innerHTML = '';
  canvas.width = container.offsetWidth;
  canvas.height = container.offsetHeight;
  container.appendChild(canvas);

  return ctx;
}

function processProfiles() {
  console.log("working on profile "+profiles[curProfile].name);

  var now = moment();
  var id = profiles[curProfile].id;

  var thisWeek = query({
    'ids': id,
    'dimensions': 'ga:date,ga:nthDay',
    'metrics': 'ga:pageviews',
    'start-date': moment(now).subtract(8, 'day').format('YYYY-MM-DD'),
    'end-date': moment(now).subtract(1,'day').format('YYYY-MM-DD')
  });

  var lastWeek = query({
    'ids': id,
    'dimensions': 'ga:date,ga:nthDay',
    'metrics': 'ga:pageviews',
    'start-date': moment(now).subtract(15, 'day').subtract(1, 'week')
    .format('YYYY-MM-DD'),
    'end-date': moment(now).subtract(8, 'day').subtract(1, 'week')
    .format('YYYY-MM-DD')
  });


  Promise.all([thisWeek, lastWeek]).then(function(results) {
    console.log("Promise.all");console.dir(results);

    var data1 = results[0].rows.map(function(row) { return +row[2]; });
    var data2 = results[1].rows.map(function(row) { return +row[2]; });
    var labels = results[1].rows.map(function(row) { return +row[0]; });

    var totalThisWeek = results[0].totalsForAllResults["ga:pageviews"];
    var totalLastWeek = results[1].totalsForAllResults["ga:pageviews"];
    var percChange = (((totalThisWeek - totalLastWeek) / totalLastWeek) * 100).toFixed(2);
    console.log(totalLastWeek, totalThisWeek, percChange);

    labels = labels.map(function(label) {
      return moment(label, 'YYYYMMDD').format('ddd');
    });

    var data = {
      labels : labels,
      datasets : [
        {
          label: 'Last Week',
          fillColor : 'rgba(220,220,220,0.5)',
          strokeColor : 'rgba(220,220,220,1)',
          pointColor : 'rgba(220,220,220,1)',
          pointStrokeColor : '#fff',
          data : data2
        },
        {
          label: 'This Week',
          fillColor : 'rgba(151,187,205,0.5)',
          strokeColor : 'rgba(151,187,205,1)',
          pointColor : 'rgba(151,187,205,1)',
          pointStrokeColor : '#fff',
          data : data1
        }
      ]
    };

    var titleStr = profiles[curProfile].name + " ";
    if(totalLastWeek > 0 && totalThisWeek > 0) {
      if(percChange < 0) {
        titleStr += "<span class='down'>(Down "+Math.abs(percChange) + "%)</span>";
      } else {
        titleStr += "<span class='up'>(Up "+percChange + "%)</span>";
      }
    }

	  $("body").append("<div class='reportContainer'><div class='chartTitleContainer'>"+titleStr+"</div><div class='chartContainer' id='chart-"+curProfile+"-container'></div></div>");

    new Chart(makeCanvas('chart-'+curProfile+'-container')).Line(data);

    if(curProfile+1 < profiles.length) {
      curProfile++;
      //settimeout to try to avoid GA rate limits
      setTimeout(processProfiles,200);
    }
  });
}
And that's basically it. As I said, I'd like to add a few options to this. Specifically, the ability to compare the current and past 30 days as well as this year versus the past. I'd also like the ability to dismiss/hide some sites I don't care about. I could use LocalStorage to remember those properties and hide them automatically.
Want to see the complete code and test it yourself? Check out the online demo here: https://static.raymondcamden.com/ga_embed/test10.html