Quick example of the Google Analytics Embed API
In my blog post from earlier this week, I mentioned how Google has a new Analytics Embed API. While it still requires a bit of programming, it is a greatly simplified version of the code you needed before in order to work with Google Analytics. As you can guess, the primary use case (at least in my opinion) for this will be to embed charts on a web site so you don't have to go to the Google Analytics dashboard to see how well your site is doing.
Oddly though the docs don't show an actual example of that use case. Instead, all of the examples rely on your own particular Google Analytic site data and each demo asks you to select a property first. Now, I get that that makes it possible for us to actually see the demos. However, it doesn't give us an example of how you would embed this on a site and ensure that the report just shows that site's particular data. It's really relatively simple, but as I said, I was a bit surprised this wasn't demonstrated.
To see how you could do this, let's start with a demo that lets you pick a property, like the demos on the site. (And to be clear, this is a demo from their site, I didn't write it.)
<!DOCTYPE html>
<html>
<head>
  <title>Embed API Demo</title>
</head>
<body>

<!-- Step 1: Create the containing elements. -->

<section id="auth-button"></section>
<section id="view-selector"></section>
<section id="timeline"></section>

<!-- Step 2: Load the library. -->

<script>
(function(w,d,s,g,js,fjs){
  g=w.gapi||(w.gapi={});g.analytics={q:[],ready:function(cb){this.q.push(cb)}};
  js=d.createElement(s);fjs=d.getElementsByTagName(s)[0];
  js.src='https://apis.google.com/js/platform.js';
  fjs.parentNode.insertBefore(js,fjs);js.onload=function(){g.load('analytics')};
}(window,document,'script'));
</script>

<script>
gapi.analytics.ready(function() {

  // Step 3: Authorize the user.

  var CLIENT_ID = '818125206534-g1r0datdtu9serq2pf9cp5vkuih3h8pv.apps.googleusercontent.com';

  gapi.analytics.auth.authorize({
    container: 'auth-button',
    clientid: CLIENT_ID,
  });

  // Step 4: Create the view selector.

  var viewSelector = new gapi.analytics.ViewSelector({
    container: 'view-selector'
  });

  // Step 5: Create the timeline chart.

  var timeline = new gapi.analytics.googleCharts.DataChart({
    reportType: 'ga',
    query: {
      'dimensions': 'ga:date',
      'metrics': 'ga:sessions',
      'start-date': '30daysAgo',
      'end-date': 'yesterday',
    },
    chart: {
      type: 'LINE',
      container: 'timeline'
    }
  });

  // Step 6: Hook up the components to work together.

  gapi.analytics.auth.on('success', function(response) {
    viewSelector.execute();
  });

  viewSelector.on('change', function(ids) {
    var newIds = {
      query: {
        ids: ids
      }
    }
    timeline.set(newIds).execute();
  });
});
</script>
</body>
</html>
That's nice, right? As I said, when I was building my own Google Analytics mashup it was quite a bit more complex than this. Here is a screen shot of the result - don't forget you can see this, and other examples, on the demo site for the API.
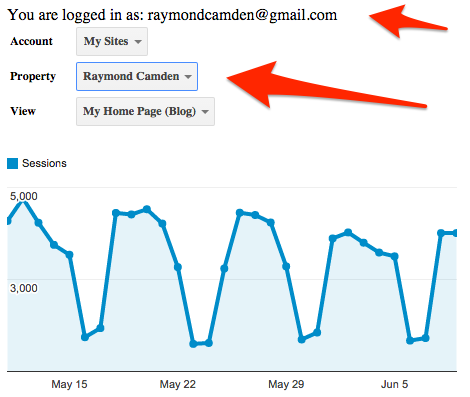
I've called out two things in the screen shot above. The first is the "You are logged in as" message. The Embed API does not let you remove this. You can change the text in front of the username, but even if you set the property to an empty string, the username will still show up. To me, this is useless information if I'm embedding in my site admin portal. And obviously the site picker itself is something we want to get rid of.
In order to make these changes, we just need to do a few things. Here's the updated code.
<!DOCTYPE html>
<html>
<head>
  <title>Embed API Demo</title>
</head>
<body>

<!-- Step 1: Create the containing elements. -->

<section id="auth-button"></section>
<section id="timeline"></section>

<!-- Step 2: Load the library. -->

<script>
(function(w,d,s,g,js,fjs){
  g=w.gapi||(w.gapi={});g.analytics={q:[],ready:function(cb){this.q.push(cb)}};
  js=d.createElement(s);fjs=d.getElementsByTagName(s)[0];
  js.src='https://apis.google.com/js/platform.js';
  fjs.parentNode.insertBefore(js,fjs);js.onload=function(){g.load('analytics')};
}(window,document,'script'));
</script>

<script>
gapi.analytics.ready(function() {

  // Step 3: Authorize the user.

  var CLIENT_ID = '818125206534-g1r0datdtu9serq2pf9cp5vkuih3h8pv.apps.googleusercontent.com';

  gapi.analytics.auth.authorize({
    container: 'auth-button',
    clientid: CLIENT_ID,
	userInfoLabel:""
  });

  // Step 5: Create the timeline chart.
  var timeline = new gapi.analytics.googleCharts.DataChart({
    reportType: 'ga',
    query: {
      'dimensions': 'ga:date',
      'metrics': 'ga:sessions',
      'start-date': '30daysAgo',
      'end-date': 'yesterday',
     'ids': "ga:31405"
    },
    chart: {
      type: 'LINE',
      container: 'timeline'
    }
  });

  gapi.analytics.auth.on('success', function(response) {
  	//hide the auth-button
  	document.querySelector("#auth-button").style.display='none';

    timeline.execute();

  });

});
</script>
</body>
</html>
So what did I change?
- I set userInfoLabel to an empty string in my authorize code. As I said, Google will still show the username in the div it is associated with, and we're going to fix that too, but this will at least make the text size smaller.
- In the DataChart embed, I hard code the ID for my property.
- Next, in my authentication success method, I hide the div that contains the authentication info.
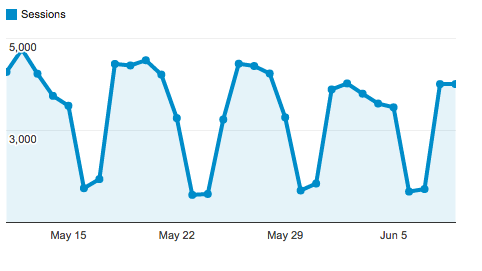
And that's it. Here is the result - which would make more sense in an admin portal of some kind but I assume you can use your imagination:
By the way, you can customize the chart quite a bit as well. For example, here is a modification that adds a simple animation as the chart loads:
  var timeline = new gapi.analytics.googleCharts.DataChart({
    reportType: 'ga',
    query: {
      'dimensions': 'ga:date',
      'metrics': 'ga:sessions',
      'start-date': '30daysAgo',
      'end-date': 'yesterday',
      'ids': "ga:31405"
    },
    chart: {
      type: 'LINE',
      container: 'timeline',
      options:{
        'animation.duration':200,
        animation:{
          duration:1000,
          startup:true
        }
      }
    }
  });
So, where did I get my ID value? Well for me, I simply modified the first code listing to console.log the ID value. Another way to get it would be to go your property settings, then to the View, and copy the View ID. Remember to add ga: in front.
I hope this helps. To be clear, this will only work if the authenticated user has access to this particular ID. You may be wondering how to handle that. You could add an error handler to the auth code, but the user may authenticate just fine and not have access. Luckily you can also add an error handler to the timeline - as simple as this:
 timeline.on('error', function(e) {
    console.dir(e);
    console.log('timeline err')
});
You wouldn't use the console to report the issue of course. You could easily add a message like, "Please contact Bob in IT so he can add you to the list of people who can access this GA account."