Simple Charting with BoxLang

Building a BoxLang and want to know how to do charting with it? The answer is simple... don't!
I kid! Sorry, but for many, far too many, years now I've argued that ColdFusion should not include a charting library. It's a server-side language, and in my (definitely not) humble opinion, client-side code doesn't belong there. (I'm fine not worrying about that though - I trust that team knows their clients better than I do and knows what they're doing.)
The good news (again, imo) is that BoxLang doesn't ship with an embedded client-side charting library. That being, I can absolutely see cases where you may be building a web app in BoxLang and want to add charting to it. Even though there's nothing in BoxLang that will create a chart for you, it can definitely help you build those charts. Here's a few simple examples.
The Data
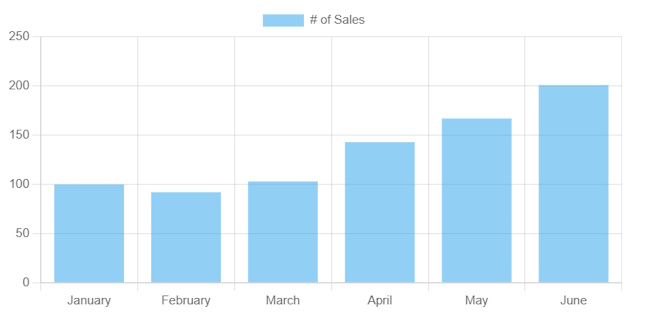
For my charts, I'm just going to render a set of sales data over a few months. I built a class with some static data:
class {

	public function getSales() {
		thisYear = year(now());
		return [
			{month:"January", year:thisYear, sales: 100 },
			{month:"February", year:thisYear, sales: 92 },
			{month:"March", year:thisYear, sales: 103 },
			{month:"April", year:thisYear, sales: 143 },
			{month:"May", year:thisYear, sales: 167 },
			{month:"June", year:thisYear, sales: 201 },
		]
	}
}
I considered making sales random, but I really wanted the chart to look the same for every reload.
The Charting Library
Any charting library would be fine, but I went with Chart.js as it was the first one that I remembered. There's probably a good twenty to thirty other different options you can use as well. I started off by creating a BXM file (BoxLang tag-based template) and literally copying over the sample from the Chart.js Getting Started guide. This was just a sanity test to ensure things worked ok.
The First Demo
For my first example, I decided to bundle the logic to get the data into BoxLang itself and output dynamic JavaScript in the response. This means when the page is viewed by the user, they're getting everything they need, and just need to load the charting library and execute the code to render it. Here's the template as a whole, and I'll explain the bits after:
<bx:script>
rawdata = new datasource().getSales();
labels = rawdata.map(d => d.month);
sales = rawdata.map(d => d.sales);
</bx:script>

<html>
<head>
<title>Chart Demo One</title>
<style>
#chartDiv {
	width: 600px;
	height: 500px;
}
</style>
</head>

<body>

<div id="chartDiv">
  <canvas id="myChart"></canvas>
</div>

<script src="https://cdn.jsdelivr.net/npm/chart.js"></script>
<script>
const ctx = document.getElementById('myChart');

<bx:output>
new Chart(ctx, {
	type:'bar',
	data: {
		labels:#labels.toJSON()#,
		datasets: [{
			label:'## of Sales',
			data:#sales.toJSON()#
		}]
	}
});
</bx:output>
</script>
</body>
</html>
The beginning of the template creates an instance of my data class, gets the data, and then filters out the array to a new array of labels and sales. Generally speaking, I don't like to put a lot of logic on top of templates like this - it was (usually) a bad idea in the ColdFusion world and not one I want to recreate in BoxLang, but as it's 3 lines - I'll deal with it.
Moving on down - the last dynamic portion is converting those two values to JSON and including it in the JavaScript. I wrapped that portion with bx:output to flag the parser to replace variables within the tag pair. Nice and simple, right? Here's how it renders:
The Better Demo
Ok, that first version worked, but honestly, I could do less on the server and more on the client if I change things up a bit. Remember that class I made earlier? I can turn it into an API in about 1 second by changing public to remote on the access property of the method:
class {

	remote function getSales() {
		thisYear = year(now());
		return [
			{month:"January", year:thisYear, sales: 100 },
			{month:"February", year:thisYear, sales: 92 },
			{month:"March", year:thisYear, sales: 103 },
			{month:"April", year:thisYear, sales: 143 },
			{month:"May", year:thisYear, sales: 167 },
			{month:"June", year:thisYear, sales: 201 },
		]
	}
}
And literally, that's it. As long as that file is under webroot somewhere, I can now get the code in JavaScript by hitting it at datasource.bx?method=getSales. Here's the new version of the template that uses BoxLang for data, but renders the HTML/JS as is, no server-side parsing at all:
<html>
<head>
<title>Chart Demo One</title>
<style>
#chartDiv {
	width: 600px;
	height: 500px;
}
</style>
</head>

<body>

<div id="chartDiv">
  <canvas id="myChart"></canvas>
</div>

<script src="https://cdn.jsdelivr.net/npm/chart.js"></script>
<script>
document.addEventListener('DOMContentLoaded', init, false);

async function init() {
	let rawdata = await (await fetch('./datasource.bx?method=getSales')).json();

	let labels = rawdata.map(d => d.month);
	let sales = rawdata.map(d => d.sales);

	const ctx = document.getElementById('myChart');

	new Chart(ctx, {
		type:'bar',
		data: {
			labels:labels,
			datasets: [{
				label:'## of Sales',
				data:sales
			}]
		}
	});
}
</script>
</body>
</html>
Note how in the JavaScript, I was able to copy and paste the BoxLang syntax right into JavaScript. Obviously that won't always work, but it's darn handy when it does. While I named this file with the bxm extension, I didn't really need to do that and would have used html in a "real" application.
Feel free to grab these files up on the BoxLang demos repo, https://github.com/ortus-boxlang/bx-demos/tree/master/misc/charting_demos.