A quick look at debugging Node.js with StrongLoop and Visual Studio Code
As I mentioned in my last entry on StrongLoop, I've decided to move on from API building and begin looking at what else is available when working with StrongLoop. Today I'm going to talk about debugging, and while it mainly "just works", I ran into a few issues that I want to warn people about.
So first and foremost, the main docs for debugging with StrongLoop, Debugging applications, mention using the command slc debug to begin debugging your application. It wasn't entirely clear to me at first, but this command is also responsible for starting your application. You can connect to an application that is running, but I figure most people are going to test locally and will probably kill their app and then start it up again via the debugger.
Now the first thing that happens after running slc debug is that your default browser will open up with the debugger. The debugger is only supported in Chrome and Opera. So if your default browser is Firefox, like it is for me, just copy and paste the URL into Chrome.
Here is where things got a bit weird for me. I noticed that nothing seemed to be working. But then I saw that the debugger was actually paused:
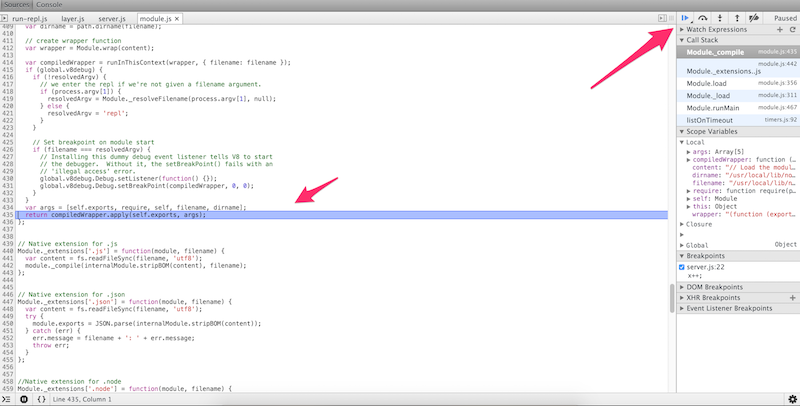
From what I know, the Node debugger wraps your code with - well - a wrapper - and for some reason it is automatically breaking at some point there. Clicking the blue arrow on the top right (Resume script execution) let's things carry on. And here is where another odd thing happened.
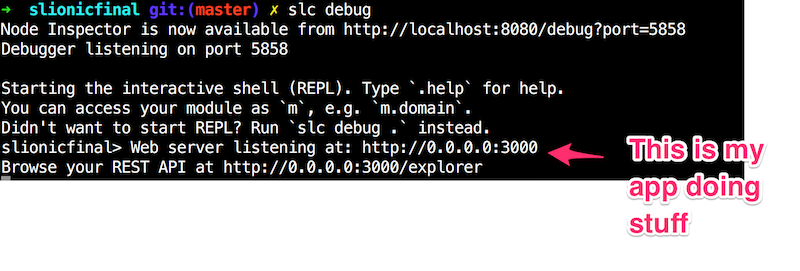
Apparently it takes a little bit of time for the debugger to get up and running. Certainly not a long time. I'd say about 30 seconds. But I was convinced the debugger wasn't working because I immediately tried to run some code with a break point and nothing seemed to work. What you want to do is watch your terminal for your app's start up message. So here is what I had initially:

I then clicked Resume in the debugger, and back in my terminal prompt I waited for it to update:
Ok, so in theory, that's it. To test, I added this route to my code:
app.get('/test', function(req, res) {
	console.log('doing test');
	var x=1;
	x++;
	console.log("x is now "+x);
	res.send('ok got stuff '+x);
});
In the debugger, I then added a break point:
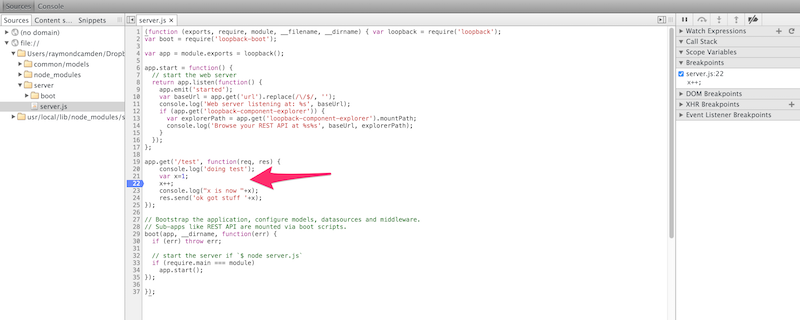
I then opened up the URL in my browser (and while the debugger wants you to use Chrome, any request to the URL at all will work) and confirmed that the request was hung while the debugger was paused.
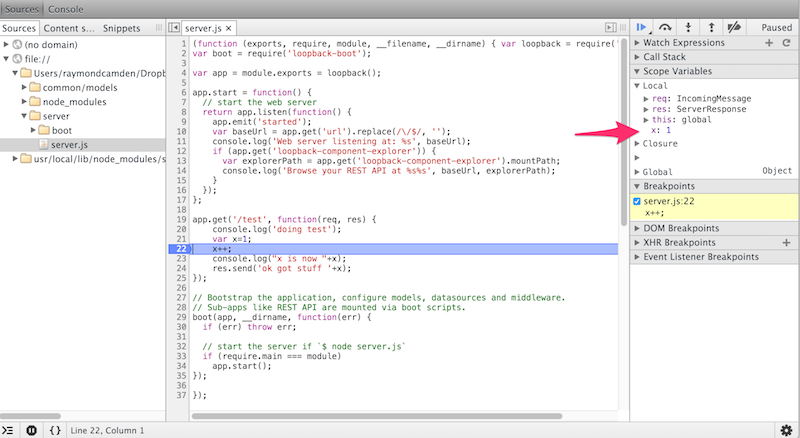
Note that you can also edit values, which is pretty freaking cool. Just double click and enter a new value and resume. All in all - cool - and easy to use.
Speaking of easy to use, don't forget that Visual Studio Code also includes built in support for debugging Node.js applications as well. I won't repeat what their excellent docs say about their debugging support. As with slc debug, you do not want to start your server. Instead, you'll configure VS Code to run the proper script when you hit debug.
Once you've done that, you can go to your files view and add a break point:
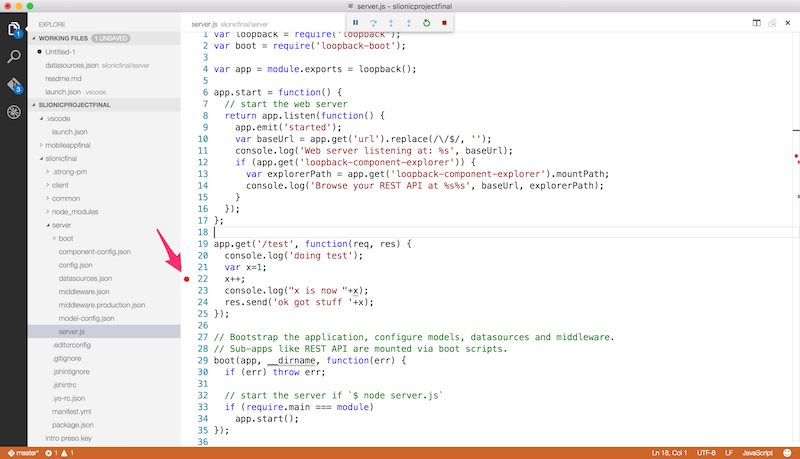
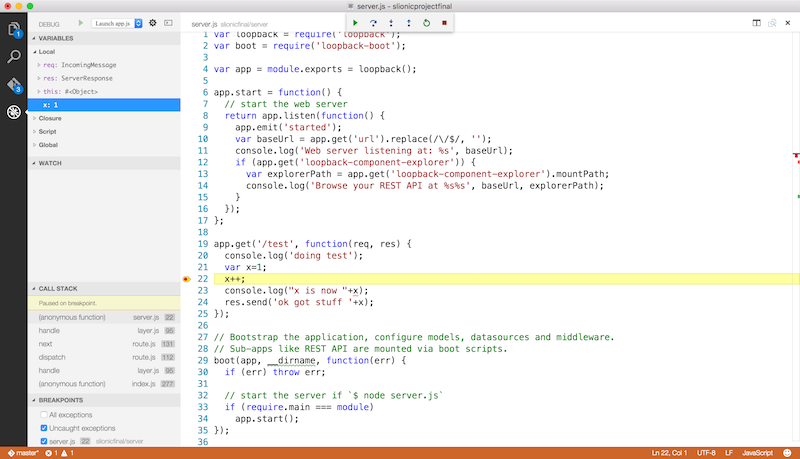
Then request something that fires the break point. Code will automatically take focus (which, I must say, I'm not sure how I feel about - in general, I never want my apps to take focus) and you can then look at variables and begin stepping through the code.
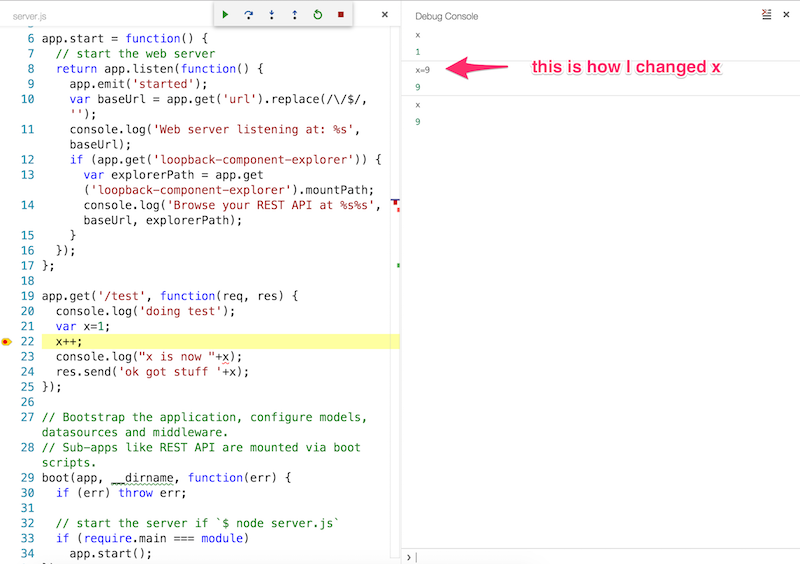
You can modify values too, but the Code docs don't make this explicitly clear in my opinion. You'll want to open the debug console and then modify the code using simple variable assignments.
So, there ya go, two interesting options for debugging Node.js applications, and yes, I know there are even more. To be honest, I'm kinda leaning more towards using Code for debugging as I like it in my editor versus my browser (which seems weird, I love dev tools), but I'll probably go back and forth.