Check out Happy Metrix (again)
Way back in the old days of 2013, I reviewed an application called Happy Metrix (Check out Happy Metrix). Back then, Happy Metrix was an Adobe AIR desktop application that let users create dashboards of stats for various metrics. I'm kind of a stat junkie (see my recent look at SumAll) so apps like these really interest me. The creators of Happy Metrix reached out to me a few weeks ago to let me know they had a pretty big update and asked me to take a look. Here's what I found.
First and foremost, this is an entirely new application. (And as a warning, if you have the older version installed, this one will not overwrite it. You probably want to delete it manually.) Along with a new desktop application, Happy Metrix now runs on iOS and the web. It doesn't look very different from the older version, just a bit more polished, but since it looked darn good before that's totally fine.

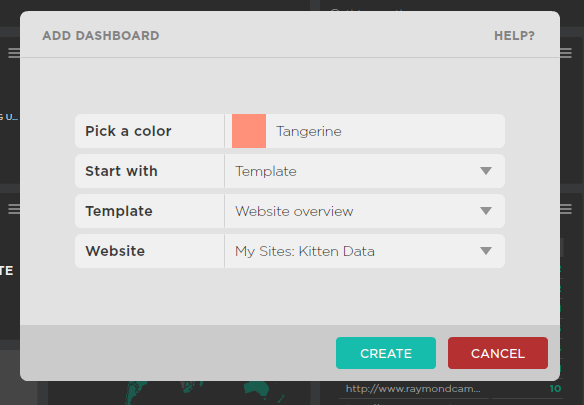
What's improved though is the "onboarding" experience for the first time user. Last time I used Happy Metrix I spent a lot of time setting up my dashboards. Now the application helps you set up a default dashboard tied to a particular website's analytics. The screen shot above is an example of the dashboard setup out of the box. It's a great set of metrics for a web site and you can add this for other sites when you add new dashboards:
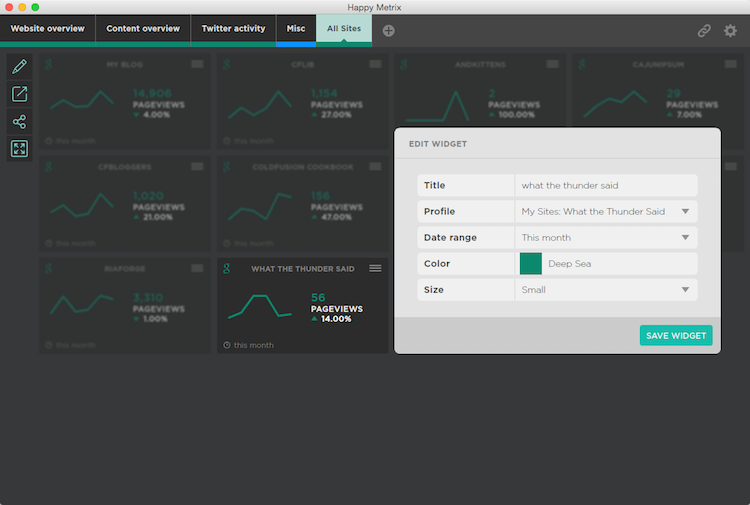
I like the idea of dashboard templates and I hope they add more soon. Another cool aspect is live updating of the widget while you edit it. You can tweak various settings and see it update live on the dashboard. Not sure how well it will come out in the screenshot, but take note of how the other widgets are grayed out and the focus is on the widget being edited.
As before you can export an entire dashboard (PDF, JPG, PNG) but you can now also export a widget by itself. That could be useful for including in emails or perhaps in a corporate presentation. Here's a sample:

I don't know about you, but I think that's beautiful.
Compared to SumAll, the number of "sources" for widgets is pretty limited. YouTube, for example, was supported before but isn't now. I questioned them about it and they mentioned it had low usage which is why it was pulled. Currently you can "speak" to Google Analytics, Twitter, Facebook, Instagram, LinkedIn, and MailChimp. Of course, they still support custom widgets, but unlike before you aren't limited to static data. You also have a butt load of ways to display them:
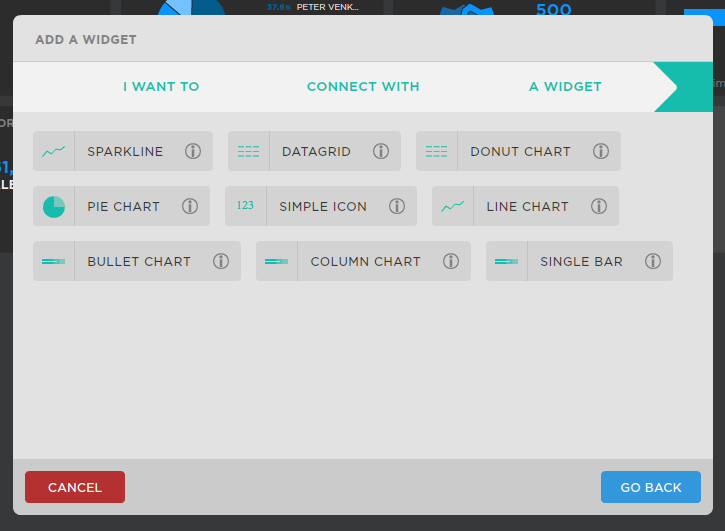
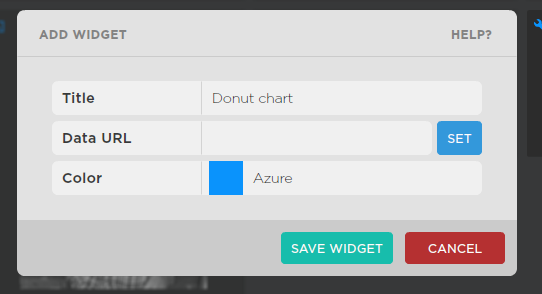
Once you select a chart type, you can then just supply a URL:
As a test, I wrote up a quick ColdFusion template to output two random values and put it up at this url, http://www.coldfusionbloggers.org/temp/test2.cfm. I set it up as a pie chart and here is how Happy Metrix rendered it:
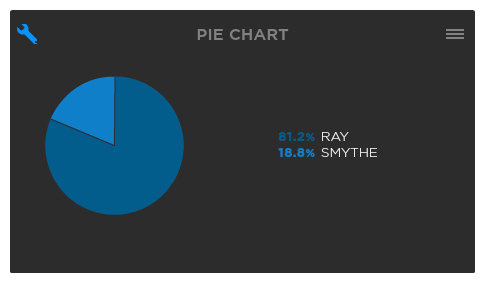
The app isn't terribly clear about how often it will refresh. From what I can see it refreshes every time I view the dashboard. Along with custom data URLs, you can also add static pictures and text. I guess that could be useful for simple messages and the like. You can also create chart widgets for static data. I'd imagine that would be useful for data you want to display that doesn't need to change often.
Probably one of the coolest new features though is the ability to share. You can share any dashboard:

Shared dashboards will have a unique URL, an expiration, and you can also secure them with a basic pin:
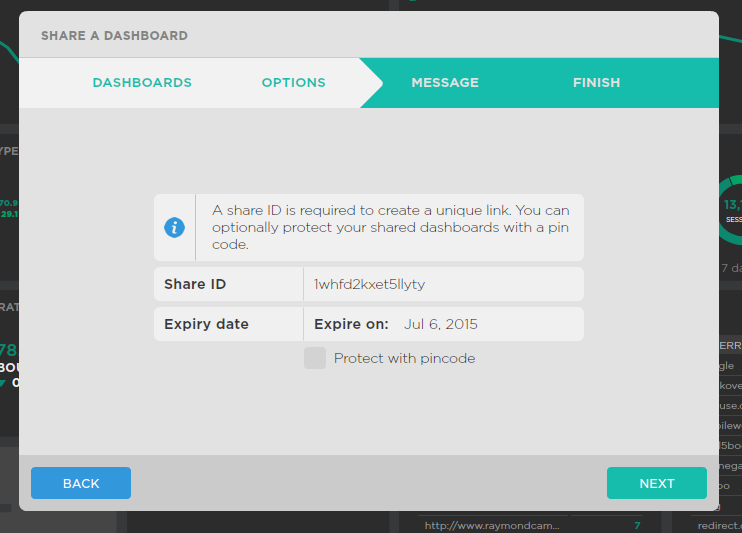
Note that the "optional message" thing is currently bugged. If you leave it blank, it is still displayed to users (as a blank window). You can see my shared dashboard here: http://cloud.happymetrix.com/1whfd2kxet5llyty.
Unfortunately, I don't see a way to manage shares. I've tested this a few times and there seems to be no way to delete/remove shared links. Hopefully that's something they add in the future.
And of course, support for the web and iOS is great too. Personally I like using it as a desktop app, but having options is great. I was going to share a screenshot of it running in iOS, but it looks identical, minus the ability to edit/share.
So - how much does the app cost? Pricing is currently at 15 Euros per month (with a year long subscription). That's not exactly cheap, but overall the current version of the app has come quite a bit farther recently. In general I can see this price being more than reasonable for folks who have to monitor these types of stats, and especially if they have to generate reports. Being able to export/share the data in such a beautiful format is is certainly something I can see paying for. You can try out the application for free, but note that they have a "nag" screen that is very annoying. I've already spoken to them about that and strongly suggested they tone down the amount of nagging it does.