Really useful Chrome Dev Tools tip
This is not necessarily a new feature, but one that really helped me yesterday so I thought I'd share it. I do not believe this exists in Firefox now (I'm using Firefox as my primary browser now), and I did not check IE, so it may be a Chrome-only feature at the moment. Yesterday I was trying to help a friend debug an incredibly weird problem with an incredibly simple bit of jQuery.
His page had a form with a submit handler. On submit he serialized the code, sent it to a service, and put the response in a div. That is about as simple as you can get. But oddly it was doing different things in different browsers. When it worked right, it was fine, but sometimes it would display the current page inside the div that was meant to display the service result.
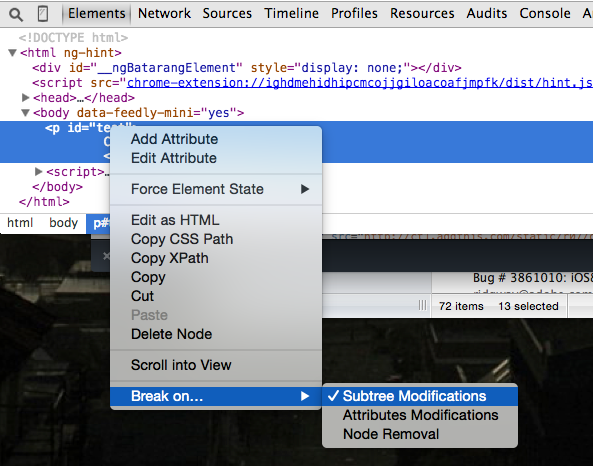
To make this even more crazy, when I commented out that part of the code, it still did that. I was going crazy trying to figure it out. I then decided to try something. I went to the div in question, right clicked, and used a Chrome Dev Tools feature. Within the Elements panel, you can right click on any DOM element and tell the browser to pause when something messes with it.
Here is an example:
I reloaded his page, submitted the form, and as expected, the browser paused. Here is a sample of what that looks like:
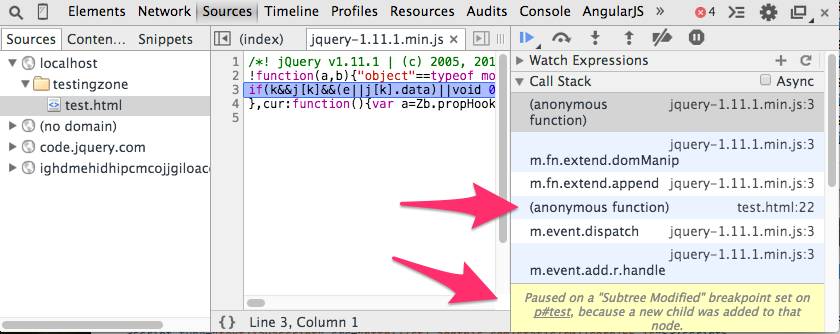
I've added a few callouts to the screen shot to make it a bit more obvious. The lowest callout is just a nice message from the Dev Tools saying why it fired. It may be obvious, but I dug that. The second call out is the crucial one. It is telling me exactly what script/code modified my DOM. In his code (the screen shots above are just from a local sample), it was actually another piece of code loaded by the template. It was a generic forms handler plugin that had also listened in for the form submit and was modifying the DOM. I had no idea this was even being used on the site until I tried this particular type of debugging.