GapDebug, a new mobile debugging tool
For the past few days I've been playing with a new, and rather interesting, mobile debugging tool called GapDebug. Currently in private beta, it will switch to an open beta around July 9th. You can sign up on the site to get notified when it becomes available.
GapDebug provides a simpler way to debug both iOS and Android mobile applications. It works with web pages, PhoneGap, and Cordova applications. If you have read my guides on this (see both this article and the follow-up), then you know that iOS requires you to use Safari to debug mobile applications and Android requires you to use Chrome. The great thing about GapDebug is that it brings both debugging environments together in one tab in your Chrome browser. Let's take a look.
After installing GapDebug, you get a new icon in your taskbar to launch a new debugging session. (GapDebug supports both Windows and OS X. That means you can debug your iOS apps on a Windows machine!) Simply click it and select "Open Debugging" to start a new session.

Notice how GapDebug picks up on all my connected devices - in this case my iPhone and my Android emulator. It does not pick up the iPhone Simulator, which is a shame. Notice too that it is detecting Safari on the iPhone. As I mentioned earlier, GapDebug supports basic web page debugging as well. (This is enabled via Settings and is not on by default.)
If you select one of the currently detected applications, a new debugging tab will open up.
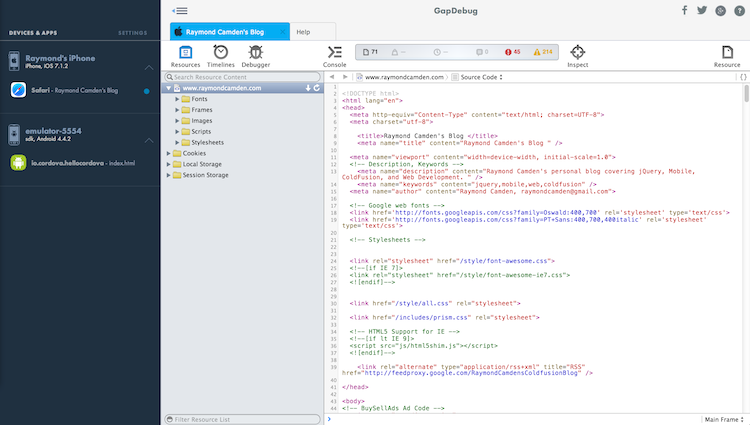
Notice that this is the same UI you get with Safari remote debugging - all without the shame of actually being seen to open Safari. (I'm kidding, mostly.) The toolset you get is based on the environment you are testing. So while the screen shot above uses the same UI you would get with Safari's remote debugger, if you select an Android app you get the same one from Chrome.

Notice how GapDebug just uses additional tabs for each debugging connection. This is really convenient. There are a few issues with the current beta that need a bit of addressing. For iOS only, modifying the DOM via the debugger is painfully slow - but just that particular aspect - nothing more. (This is already reported to the team and is being addressed.) Everything else, like the console, the debugger, etc. runs great. Another issue is that if you rebuild the application, your debugging tab becomes disconnected and you have to reconnect. This is being investigated for a fix in the next version. It is annoying, but less annoying than having to go to the debug menu in Safari and click around to reopen the debugger there. That sounds like a minor thing, but I can't tell you how much it bugs me with Safari.
So far, I'm pretty impressed. If you are a Windows user, this tool will be a must have if you want to do any iOS work. For me, it just feels a heck of a lot more convenient to use - especially if I'm going to be testing Android and iOS both in one session.
To learn more, check out the GapDebug web page and follow them on Twitter.