File this under the "Yet Another Thing Probably Obvious to Everyone But Me" folder, but have you ever seen (index) in the Chrome Dev Tools console and wonder what in the heck it was?
I had seen this from time to time but never got around to figuring out exactly what is was. Finally I forced myself to dig into it and it is- as expected - incredibly obvious.
If you view a web page without specifying an index document, for example: http://localhost/testingzone/, then the web server will attempt to load an index document for that folder. That index file could be index.html, or anything else actually. Here's the thing though. When Chrome needs to tell you the file name of the code generating an error, or console.log message, it can't, since it doesn't know the real file name.
Therefore: (index)
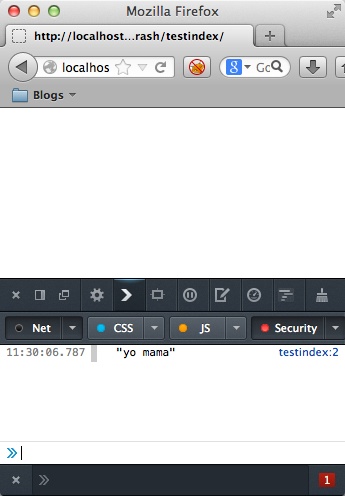
In case you're curious, Firefox does this (note that the last folder in the URL was testindex):
Now you know - and we all know what that means.
Archived Comments
Somewhat related: Did you know that there is a trick to get inline javascript to show up in the 'scripts' tab in DevTools (I believe it works for FireFox too)? Just add a comment at the end of your inline block like so:
//@ sourceURL=whateverfilenameyouwanttouse.js
Geeze no - I didn't know that. How did you figure that out?
Another good console trick. If you want to put a break on a specific line in a programmatic way, add the line:
debugger;
Firebug and Chrome will both break on that line. I often find this faster in development when tracking down a problem. It's especially useful when needing to step debug in multiple browsers.
Todd's comment comes from source map support. See https://developers.google.c... and scroll down to @sourceurl.
Thanks to @edyionescu for pointing this out on Twitter.
... or you could use Chrome DevTools Workspaces: https://plus.google.com/+Ed...
@Edy: I'm just not a fan of editing in the browser. For live JS debugging i can see it being useful, but for "real" development, I'd rather use my editor than the dev tools.
@Raymond: Couldn't agree more. But, because workspaces deal with mapped system resources, you'll no longer see (index) in the console.
Fair enough. Although in my case, I was debugging someone else's web site - not a local app. :)