A few years back a good buddy of mine (Ryan LeTulle) demoed a cool real estate map application he built. I asked him to blog it (because, everyone has a blog, and time to blog, right?) but he never got around to it. Last week I asked him if he minded me rebuilding what I saw him do, and he said go for it. Thanks Ryan for the inspiration!
Have you ever tried to use a real estate site to find homes but had trouble narrowing down your search criteria? For example, you know what city you want to live in, but also what area. If you're lucky, the site lets you search by subdivision, but how in the heck do you figure that out? My subdivision is Ivanhoe, but I lived here about 10 years before I realized that.
What you would really like - I imagine - is being able to draw your search criteria. Given a map of the city and a vague notion of where you want to live - what if we could draw a region and find results within it?
This idea relies on two main aspects. First is the ability to draw on a map. I'm going to be using Google Maps for this project. Google Maps is a pretty darn deep API. It allows you to draw markers, lines, boxes, and polygons in general on a map. It also allows for deep interaction with those UI items as well.
While I researched this idea, I discovered they had a feature called "User-editable Shapes". As you can imagine, this lets a user move and adjust a shape on a map:

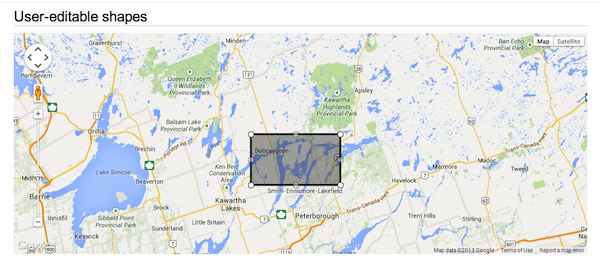
This is nice - but a box isn't exactly precise enough. I decided to begin with simple lines (what Google calls Polylines). I created a map and then used click events to add markers with lines connecting them. Luckily Google had an example of this already (Polyline complex) so I began with that. I made one modification though. I set it up so that as soon as you had clicked three times, I'd "close" the box automatically for you.
As an example:

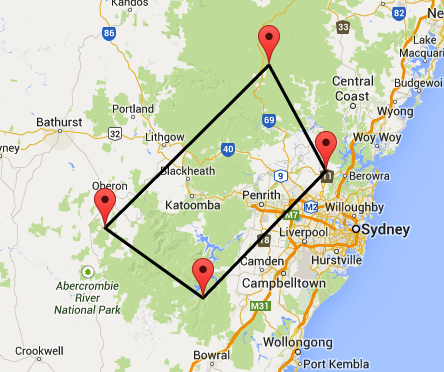
The code is rather simple - just notice how many lines we've drawn and on the 3rd click, automatically close the box:
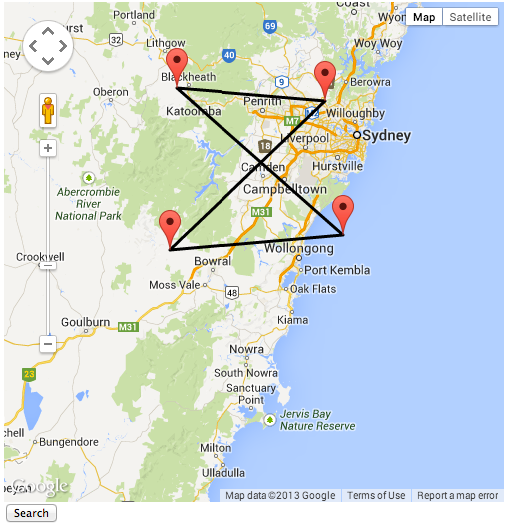
This worked... ok (and you can demo it here), but I felt bad I was forcing you to search within a four sided polygon. What I really wanted was the ability to let you click as much as you want, and when you're done, close the 'box' automatically. As an example, I've created a multi-segmented polygon here and clicked search to complete the region:

Overall, I felt like this was a good solution. Now - right away you may be asking - what happens if you draw something crazy, like, oh say this:

Don't do that. Seriously.

Ok... so at this point, we've covered the first main aspect of this project - giving you the ability to 'draw' a region. Now comes the second. Given that we know the region, how do we find crap inside it?
I was a bit torn about this aspect. Turns out there is a client-side solution provided by Google (no surprise) but also server side code you can use as as well. CFLib has a UDF (PointInPolygon) nearly 10 years old that would do this. So in theory - we could hit a server database, do some logic, and return the points. Or - we could do it client side. Keeping the data on the server allows for quicker initial load. Keeping it in the client lets us search a bit quicker, but makes the first load 'fatter'.
I decided to go with a client-side solution. Mainly because I wanted to test this particular Google API, but also because I was curious how 'bad' the hit would be if I did store a large set of data on the client. In my example, I'm only storing longitude/latitude data. I'd imagine that once you click on a result we could do an AJAX ping to get further data. Or heck, we could do so as soon as you complete your polygon. I wrote a script (you can view source here) to generate 400 different long/lat pairs that were roughly in the Lafayette area. This script outputs a JavaScript variable I could then take and save into a file called data.json.
Now that I had my data, I could update my code to load it into memory. As to how I could filter the data, I made use of Google's Geometry library. It lets you pass a long/lat point and a polygon and it returns true if the point is within it. Here is the updated edition. You want to pay attention to the doSearch function:
As you can see, I loop over the data and pass it to the Geometry API. If a match is found, I add a marker. When done, I report on the total matches. You can demo this by hitting the giant demo button below. Note that hitting Search twice will destroy the universe. Don't hit search twice.
p.s. I actually tested "crossing the streams" and it worked perfectly. I knew it would. Honest.
Archived Comments
Ray,
A large UK based property search website, Rightmove, uses a similar method to very good effect http://bit.ly/14VUkNl very handy!
.. and might just have found my new house using it lol.
Tom
Very useful to see how it's done. What if you had 100K+ long/lat pairs in a database and it wasn't practical to have so many downloaded to the client. I guess the "points in poly" code would have to run as part of a sql query and the web server would send the results as json straight to the client. I think MS SQL 2008+ has a function to calculate that.
Nod - I'd have to imagine the logic can be done in pure SQL as well.
Zillow has a freeform drawing tool for their maps, it's pretty slick.
I put together an easy way to implement one:
http://dannyrscott.github.i...
It's for Bing Maps but the logic could easily be converted to Google I think.
No demo, Danny?
Whoops, demos are useful aren't they :)
Quick and dirty one:
http://dannyrscott.com/demo...
Shows off:
The difference between the mouse drag draw and the click to start and end draw (I prefer the mouse drag).
How do use the callback, including how the polygon is passed to the callback
Different polygon options.
Not bad. I swear I didn't draw anything inappropriate.
Danny, do you have or know of a free form plugin or code for google map api?
Thx, Kevin
Hi Danny,
I just got you article after spending number of hours researching about getting search result after drawing on Google map.
When I run this script, which is copy of you script, I get message 'Found 0 results'. I tried wring data in console.log. Seems like their is problem in data parsing or something. Tried a lot, but no luck.
I download data.json, app3.js and copied source code from you demo and executed that. But every time it says Found 0 result.
Could you help me in this please?
Regards,
Purnima
When I do
alert(locData.length);
Alert shows output 9861. data.json is same as your file.
Thanks
Sorry Raymond! Mistakenly named your name as Danny.
Hmm, nothing comes to mind. What is the URL of your version?
Thanks for your reply. The link is here http://www.london-tokyo.co....
I tried exporting files to different server and it started working. But still I want to know why its not working in above link as I think server doesn't play any role in this program.
I noticed it returned the json as plain/text. That could be it.
Raymond Thanks a lot! Yes, you are right I added Mime type on server configuration and it worked fine :)
Wooww Awesome Stuff ... Thanks a Ton .... You saved me lot of time .. Keep up the Good Work .:)
Guys what if you want to build multiple different locations. Say you want to outline neighborhoods or cities and you want to capture from the user where they click on the surface of the map to pull out the neighborhood or city that they are clicking on top of. Anyone know how this is possible. google does a great job of outlining neighborhoods in Europe and north america but not so good in neighborhoods in Africa and some of asia. Thank you
I'm not quite sure I get your question, but the Google Maps API does let you handle click events.
Hello Raymond, after much searching your article seems to move me much closer to using shapes in Google Maps to set up query's in a sql data base. I am having trouble setting up a map to use the example code you have provided. The Map never loads. I know there is a lot that could go wrong to cause this but I am looking for some advice or maybe a sample HTML doc to get started with.
Thank you so much for sharing your work!
Could you share it online where I could try to debug?
Thank you for your
willingness to help! Before we go that route, let me explain my end goal.
I have an excel sheet with customer data that includes information on the
number of prints they make per month on each of their printing devices. Each
line includes the machine data , average monthly volume and the lat and lng for
the location of the customers’ business. I want to plot those locations on a
map, draw a polygon and add up the number of prints made for all the different customers
equipment in the shape I draw. I am
searching for the easiest way to go about this. I seem to find all the bit and pieces in my research
but need some guidance on how best to advance on putting it all together.
Well I'd start simply. Can you get the points plotted?
I agree, Using "My Google Maps" yes, I can plot my customer data but it seems we are very limited from there... Creating my own Google Map using the Maps API and JavaScript, I was tinkering with what seems like a basic approach using Alasql.js and Xlsx.js to plot data from a excel sheet, found here, https://stackoverflow.com/q... ( agershun's post ) but so far no luck, I am just teaching myself a lot of this. Still exploring if I should plot my data right on the map in a API data layer or store and run query's in local data base. Not really looking for a enterprise type solution so simpler is better! I could be dealing with as much as 100K data points but working in smaller batches of 5 to 10 K could work as well. Thanks again Ray, I can share files multiple ways or provide a mail address as well.
I'd rather not work with your files as I'd have to set them up. What I really want to see is something online where you tried to get it working, and it failed somehow, and I can maybe help you with a particular blocker, if that makes sense.
It does, Based on the stackoverflow post I referenced, I hosted a basic map here.. http://territorymap.atwebpa...
In the same directory I have - alasql.min.js, xlsx.js and a sample .xlsx file with 4 columns - customer, Latitude, Longitude and mark.
When I open the browser console, I see an error:
TypeError: jszip is not a constructor[Learn More] xlsx.js:20266:38
read_zip http://territorymap.atwebpa...
readSync http://territorymap.atwebpa...
y http://territorymap.atwebpa...
onload http://territorymap.atwebpa...
Check it now! Thanks for the help, using the console will be my friend going forward I am sure... I was not referencing the Alasql.js and Xlsx.js correctly. So much more to explore and learn. Do you think your "doSearch" function can be modified to read the data stored in the map itself?
Well maybe. You should be able to get access to the markers. Since I have access to the original long/lat points, I can just use that. In theory you should too, right?
I think so, I will try to store the needed data as an property of the Marker object, then figure out how to read that from inside a polygon. Seems to me this should be possible..
Ray, I put aside my idea of reading the markers for now and am trying to get your script up and running. I put a basic map, your script, "gistfile1.js" and data.json into a folder but can not get it to run correctly... its at the same link I posted above, would you be willing to have a look and help me to the next step?
The most important tip I can give you, for web dev in general, is to learn to use the console. I found the issue (well the bug) the second I opened it up:
ReferenceError: google is not defined
I think it may be this:
<script src="gistfile1.js"></script>
<script src="https://maps.googleapis.com..." async="" defer=""></script>
I believe you need to reverse those. If you look at the source of my demo, view-source:https://static.raymondcamde...
HI Ray, I have updated my code to show my data file in the counsel
http://territorymap.atwebpa...
I just have 3 points for my test map which I can plot by using .addGeoJson(data);
I have no other errors in the counsel but my search always returns zero results.
Is my data file format wrong?
Hey I'm sorry - I got distracted and it looks like your test site is gone.