Playing with SVG and JavaScript
For some reason, I never took a real good look at SVG (MozDev link) in the past. I knew, conceptually, that it was a way to describe graphics in XML format and I knew Adobe had a large amount of history/support behind it, but I never really thought it was useful for what I do in my day to day work. That was until last week when a reader sent in an interesting question.
The reader wanted to take county data for America and render it on screen. Initially I was at a loss as to how this would be done. Obviously the AJAX portion wasn't a big deal, but I had no idea how in the heck this would be rendered. The reader then linked me to this resource, a map of America in SVG with each county defined in pure, glorious data. I did a bit of research and discovered that SVG data exists in the browser DOM. This means you can edit - as far as I know - pretty much anything - related to the data. Woot!
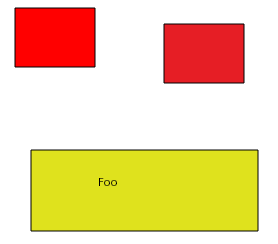
I decided to start simple though. I knew that Adobe Illustrator could spit out SVG files, so I opened up Illustrator and used all of my artistic talent to create this.
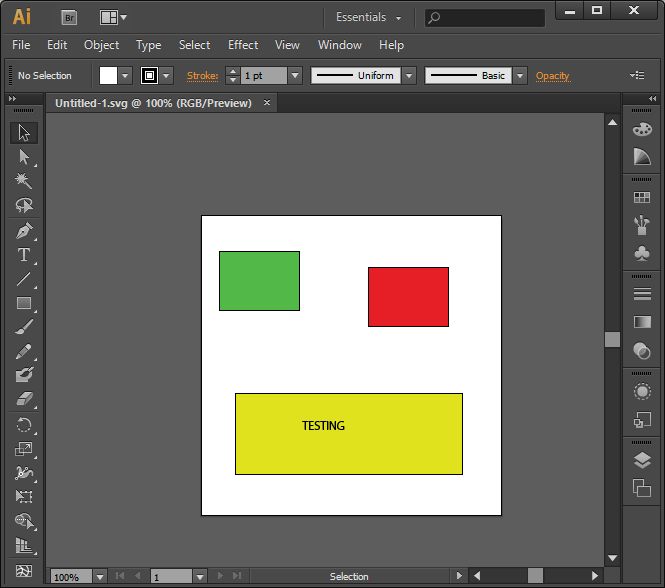
While not the most exciting graphic in the world, it gave me something to start with. The SVG file is completely XML based. You can see the source for it here:
Having never seen SVG before you can take a good guess as to what each part does. I did a bit of research and discovered that one way to access the SVG data is via the getSVGDocument() DOM call. In order for this to work though you have to wait for a load event on the image. I used an object tag to embed the SVG file, added an event listener, and then did two simple modifications.
Not terribly exciting, but also pretty darn simple. You can run the demo here, or look at the screen shot below.
I tested this in Chrome, Firefox, and IE10 and it worked great there. From what I could see in my research, the "basics" of SVG worked pretty well everywhere, but the more advanced options weren't universally available. (Check out this list of SVG options at CanIUse.com for more information.)
So given that we have JavaScript access to individual parts of a SVG document and we can easily modify that data, I took a look back at the American county SVG document. It is a very large file (about 2 Megs) and includes data that 'draws' each county in a path tag. Here is an example of two counties.
As I didn't have access to any real data to display, I whipped up a quick ColdFusion script that parsed the XML, reads in the county data, and creates a value for each county from 1 to 10. For now, let's assume the number represents how likely you are to be eaten by a grue. My script then saved this file as X.json, where X represented a year. I created files for 1990 to 1995. Now I had my data, I just needed to build the application around it.
One of the first things I wanted to do was ensure that this huge SVG file wasn't dragging down the entire application. My boss, Alan Greenblatt, recently posted on this topic: Asynchronously Loading SVG. I decided to do something a bit more complex. While his solution would allow me to delay loading the SVG, I wanted to skip loading the SVG altogether if the browser supported IndexedDB. I quickly whipped up some logic to handle this.
That's quite a bit of code I suppose, but it really just boils down to the following steps:
- The user's browser supports IndexedDB
- Open the database and see if we need to create the initial store
- See if we have the data in there already
- If not, set a flag saying we are ready to store the SVG and fire off the request to load it via Ajax
- No IndexedDB? No problem. Just load it via Ajax
- And do one last check to see if we did support IndexedDB but just had not loaded yet. If so, store that puppy.
The end result is to then call loadSVG.
All this does is draw out the SVG into the DOM and add listeners to a few buttons. The buttons are used to load the remote JSON data I created earlier. Now let's look at that.
loadYear is a relatively simple Ajax call to our JSON file. Once we have the data, I loop over each county, get the value, and translate the 1-10 value to a color from red to green. Thanks to Cliff Johnston (@iClifDotMe) for the RGB values.
The end result is pretty cool I think. The JSON files clock in at about 70K each so they aren't too bad to load. You can see the full demo here: https://static.raymondcamden.com/demos/2013/feb/2/test3.html
For me, it took about 5 seconds to load initially, and each Ajax call "feels" about a second or so. Considering the amount of data being pushed around I feel like it performs adequately.
But then I decided that wasn't enough. I figured if we are caching the county shapes, why not cache the remote data? I whipped up a quick modification to store the data in the SessionStorage cache of the browser.
A trivial modification, but if you click around a bit it should be a bit snappier. You can find that demo here: https://static.raymondcamden.com/demos/2013/feb/2/test4.html