Over the past month or so I've been working on a Chrome extension that makes use of dev tools. My goal was to learn more about building Chrome extensions in general. My plan of attack was a Chrome port of ColdFire.
For my readers who don't use ColdFusion, ColdFire is a Firebug extension that takes ColdFusion debug information and renders it in a Firebug template. ColdFusion does a pretty darn good job of sharing request-level debug information. This is great for times when your pages are slow and you need help tracking down why it's slow. For example, maybe in a typical request you've got 5 API calls to components and 10 database queries among them.
Now imagine the request is taking 10 seconds. That's an insane amount of time for a web page to load. But given all the activity, how do you track down what process is taking the longest?
By using the debug data, one could discover, perhaps, that it's one particular query that is borked. One query taking 99% of the total time. Data like that is invaluable.
Normally this debug information is crapped at the bottom of the page. Firebug and ColdFire make it prettier. Here's an example from the Firebug version:

I had previously written a basic extension to create a panel (see this blog entry) and then some code to actually update the panel (see this blog entry). Now I needed to actually take the debug data returned by the server and render it the Chrome DevTools panel.
I had assumed this would be simple. I grabbed a copy of Handlebars and began creating a basic template. But right away I ran into an issue. As soon as I tried to compile my template, I got a security error. Some quick Googling turned up this Chromium bug report: extensions doen't load for some valid CSP schemes
There's a lot to that bug report, but the summary is that anything using eval() is going to be prohibited in extension code, unless you want to use an iFrame. (Anyone who has done Adobe AIR for HTML will remember this.) While the official docs recommend using an iFrame (see this reference), I went an easier route. A fellow named Matthew Robertson blogged on this very topic and recommended making use of Handler's precompiled templates. Essentially, this is a way to write your templates, compile them with Node, and include a new JavaScript file into your project.
This worked fine, except to note that I was not able to use *.handlebars at the command line. Instead, I used this syntax: handlerbars file1.handlebars file2.handlebars file3.handlebars -f ../template.js
At that point, it was pretty easy to continue. I've blogged before about how it can be difficult to debug Chrome extensions. For the most part, you can't just save a file and reload one file. I had to close two devtools instances, reload the extension, reload my test page, open up devtools, and then open up another devtools extension as well. After a few hours of this though I got pretty quick. (I've got a bad headache though so consider that as well.)
For folks who want to try this out, you can download the bits at the end of this post. Note that it requires the main ColdFire cfm handler template to work. For folks who could care two bits about ColdFusion, I'd still love any feedback on the extension in general. Currently "General", "Execution Times", and "DB Queries" are working.
Hey - how about some screen shots? Sure, why not. Here is the General tab:

And here is Exec Times - make note of the total times at the bottom. It calls out how much of an impact the database had on the request as well as component calls.

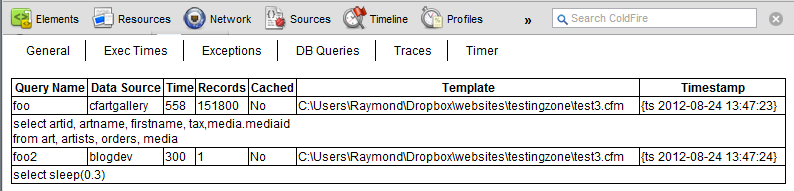
And then finally - the db queries. Note the horrible SQL I wrote to create a cross join. Oddly it still ran incredibly fast.
Archived Comments
Already helped me find a minor problem. Thank you. Need to ability to pick the cfm file being viewed like the FF version. I have an iFrame on an index.cfm page and it takes "ownership" of the ColdFire output.
Experiencing intermittent behavior on the tabs. Mostly non-functional for DB Queries and Exec Times. Chrome 21/Windows 7
1) Yeah - it should be possible to add that in.
2) Can you dig into to see why? Open dev tools in a new window. Click on dev tools to make it active. Then open another dev tools (using the key combo) and go to the console. You may see an error there.
I found:
Uncaught TypeError: Cannot read property 'document' of undefined devtools.js:69
Different computer, same configuration and the same problem.
Ah, the hide event handler. I didn't test that. ;) Will take a look next week.
I'm sorry if I'm missing something but are there instructions on how to add this? The readme file in the download just thanks someone. Thank you!
First - follow the main directions (for ColdFire) to set up the debug template in the CF Admin.
For Chrome - extract my zip. Go to Tools/Extensions and load unpacked extension. Point to the directory.
Then - go to a CFM, open up Dev Tools, and pick the ColdFire tab you should see.
Beautiful, thank you so much for the quick reply and all your CF work. Works well so far. I'm not too familiar with chrome extensions and didn't notice the "developer mode" checkbox when you go to the extension page
Yeah, sorry - I've been neck deep into this stuff (see my earlier posts) so I'm kinda used to it. Plus, with Chrome rapidly updating, stuff changes every week or so. ;)
What are the steps to install ColdFire in Chrome? I downloaded the zip file but do not see any instructions on how it implement in Chrome.
Thanks
Read my comment to Jeff above.
Hey, its me again (but no tweets whatsoever this time, promised :) )
I got the extension installed, but I can only see the general tab, clicking on the other tabs has no effect.
(Chrome 21.0.1180.82, Mac OS 10.6.8)
Right now General, Exec Times, and DB Qeuries should work.
Oh - go into your CF Admin and ensure you have 'turned on' those other debug options. They aren't on by default.
all those options are turned on and I can see them in the classic CF debugging template, meanwhile I also tested in Chrome on Windows and got same the same behavior.
Tomorrow I will check if there is something wrong with the debug template on our server. (CF Standard 9,0,1,274733 on Linux, latest ColdFire template should be installed)
the ColdFire template on our server is OK, everything showing up as expected in Firefox/Firebug (off topic: just had to re-activate the ColdFire tab in Firebug as described in https://github.com/nmische/... )
The Chrome version is behaving a little strangely at the moment however...
- no debug output is showing up in the ColdFire tab for the first cfm template called after starting up
- for the second page/template there is only the General tab - most of the time.
- the Exec Times and DB Queries tabs were only showing up once so far
- debug info for the third, fourth template etc. is not always showing up, will look into that later
- debug info in the HTTP header seems to be complete, even if the 'other' tabs are not clickable. (I got response headers like x-coldfire-cfcs-1, x-coldfire-exceptions-1, x-coldfire-general-1, x-coldfire-queries-1)
HTH
Thilo - thanks for the detailed response. I'll reply more later, but just as an FYI, it is known that some of the tabs are not done yet. I noted above only General, Execution TImes, and DB Queries are active now.
This looks interesting.
http://craig.is/writing/chr...
Agreed. I saw the CF one a few days ago.
Download file link is dead :'(
See http://coldfire.riaforge.org.
can you share Coldfire for Chrome please ?
No - follow the link please. I no longer maintain this.