Setting up console debugging for PhoneGap and Android
In case you haven't figured it out yet, debugging in mobile is "sub-optimal". (Whatever you do - don't do a Google Images search on sub-optimal.) Brian Leroux has an epic presentation on the topic and I highly encourage taking a look through it. I thought I'd share how I'm debugging in PhoneGap and Android right now.
To be clear - this is a sucky way of doing it. "Sub-optimal" is being too nice. Whenever possible I do as much work as I can on the desktop. But when I get desperate and need to test something on a device, I end up resorting to console.log messages. I know this is only one step better than a bunch of alerts, but I thought it might be useful to show how this is done with Android and some tips to make it a bit more palatable.
First - I assume that you are actually using the Android SDK to create your APK files and install. What I'm going to show will work if you use Build to generate your APK, but the tool comes from the SDK. Open up your SDK folder, go into the tools subdirectory, and run "ddms". This stands for "Dalvik Debug Monitor." Here's a screen shot. Notice it has my device in the upper left hand corner.
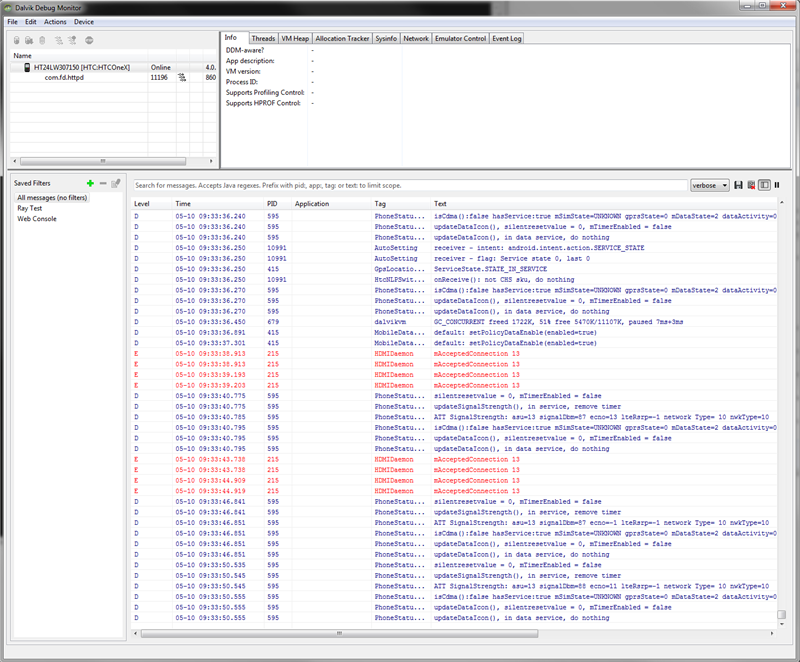
You will also notice an ungodly amount of messages in the main log panel. This is everything your device is doing. Everything. We'll filter that in a second.
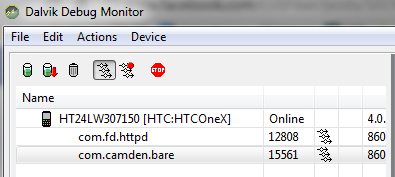
So start up your application, and you should notice the process is now listed below the device. My application had an ID of com.camden.bare, and this is what shows up when I run it.
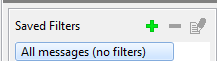
The first thing you want to do is create a filter. In order to actually see your messages in all the noise your device is generating, you need to create a filter by hitting the pretty little green plus sign.
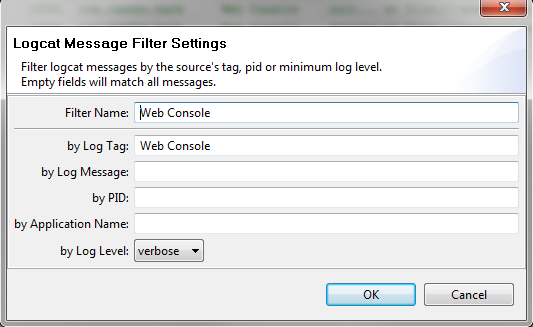
In the form that pops up, give it any name you want, but be sure to use the 'by Log Tag' field and specify "Web Console":
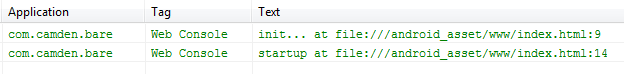
Ok, at this point, you can now see messages when your application makes use of console.log. Consider this simple PhoneGap/Camera application:
I've got a few console messages for my events. They aren't incredibly helpful, but they let me know things are progressing as I expect. Here's a quick example:
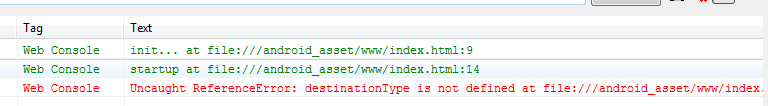
What's cool is that it will also log unexpected errors for you. I wish I could say I planned this, but I did make a mistake in my "simple" little application and I saw it immediately in ddms:
In general, that's it, but here are a few more tips to keep in mind:
-
I find that I have to click on my filter to 'refresh' the list view. Remember that if you don't see the panel updating.
-
console.dir "works" in that it prints out to the log, but it's not a nice interactive tree like you see in Firebug. If you use that on a complex object, or even console.log, you pretty much end up with [object Object]. Instead, use JSON: console.log(JSON.stringif(something));
-
If you make use of the tip above and find that log message is super long and hard to read, then mouse over the log line and wait. A tooltip will appear with the message in a smaller, easier to read format.
I hope this helps. Again - I'm not putting this out as a great way to debug. It "works" now but could certainly be a heck of a lot better.