Getting ORM Stats via the Session and Factory
I hate Mark Mandel. Sure - he is easy to hate in general. Just ask him to say cache and you will have plenty of reasons. That being said - I have a new reason to hate him tonight. Because of a simple, offhand remark about ORM and ColdFusion debugging, my brain went into a death spiral of code writing and playing to see what I could dig up. What follows was written very quickly, and while it's dark cool as heck, please use with caution. If anything goes wrong - blame Mark.
So Mark brought up the question of whether or not we could get some ORM information in the ColdFusion debugging panel. I've played quite a bit with those templates (remember that the stuff you see when debugging is turned on is actually generated by a custom tag) so I thought I'd give it a try. I also knew that ColdFusion 9 gave us access to both the current ORM session (ormGetSession) and the ORM factory (ormGetSessionFactory).
Back when ColdFusion 9 was still in beta, I took a look at these functions and the JavaDocs behind the Hibernate services they represented. I knew there was "cool stuff" in there - I just didn't realize how cool. Unfortunately, what follows won't work too well in the debugging page (will explain why later), but the stats themselves kick butt. So what can you get access to?
You can:
- See the DSN and determine what database type and version it is. Ok, you probably know this, but for distributed applications, it could be useful. Using Hibernate doesn't mean you never write SQL again, and if you do have to write SQL, it would be helpful at times to know the engine in use.
- You can list the entities that were used for the request. So again, you probably know what data you use in a request, but in a larger application, you might not. I've got a complex Model-Glue application which does a heck of a lot of stuff, and I can see this being helpful in getting a grip on it.
- But the really cool stuff comes next. For the application as a whole, you can determine the total number of inserts, loads, updates, and deletes. You can then get the totals per entity. So for example, you may find that one type of data is getting a heck of lot of throughput. That entity type then may be a candidate for extra caching or performance tuning.
So you get the idea I think. Basically I dumped the results of ormGetSession and ormGetSessionFactory and well - played. I then consulted docs (this one especially) and from that I built out the following simple custom tag. It's a pretty poor tag in that it just dumps crap out to the page. You should modify it to return the data. This could then be turned into a nice little dashboard.
<!--- Get the factory --->
<cfset f = ormGetSessionFactory()>
<cfset fStats = f.getStatistics()>
<!--- Enable stats --->
<cfset fStats.setStatisticsEnabled(javacast("boolean",true))>
<!--- Get the session --->
<cfset s = ormGetSession()>
<!--- Get the stats for the session --->
<cfset sessionStats = s.getStatistics()>
<!--- DSN --->
<cfset dsn = s.connection().getCatalog()>
<!--- Type --->
<cfset type = s.connection().getMetaData().getDatabaseProductName()>
<!--- Version --->
<cfset version = s.connection().getMetaData().getDatabaseProductVersion()>
<cfset s.disconnect()>
<cfoutput>
DSN=#dsn# (#type# #version#)<p>
</cfoutput>
<cfset entityCount = sessionStats.getEntityCount()>
<cfset entities = sessionStats.getEntityKeys().toArray()>
<cfset niceEntities = []>
<cfloop index="e" array="#entities#">
<cfset name = e.getEntityName()>
<cfset id = e.getIdentifier()>
<cfset arrayAppend(niceEntities, {name=name, id=id})>
</cfloop>
<cfdump var="#niceEntities#" label="Entities in this request">
<cfset totalStats = {}>
<cfset totalStats.inserts = fStats.getEntityInsertCount()>
<cfset totalStats.loads = fStats.getEntityLoadCount()>
<cfset totalStats.deletes = fStats.getEntityDeleteCount()>
<cfset totalStats.updates = fStats.getEntityUpdateCount()>
<cfset totalStats.hql = fStats.getQueries()>
<cfset totalStats.entities = {}>
<cfloop index="n" array="#fStats.getEntityNames()#">
<cfset totalStats.entities[n] = {}>
<cfset stats = fStats.getEntityStatistics(n)>
<cfset totalStats.entities[n].deletes = stats.getDeleteCount()>
<cfset totalStats.entities[n].inserts = stats.getInsertCount()>
<cfset totalStats.entities[n].updates = stats.getUpdateCount()>
<cfset totalStats.entities[n].loads = stats.getLoadCount()>
</cfloop>
<cfset totalStats.flushcount = fStats.getFlushCount()>
<cfset totalStats.sessions = fStats.getSessionOpenCount()>
<cfset totalStats.transactions = fStats.getTransactionCount()>
<cfdump var="#totalStats#">
That's a lot of code - but as you can tell - most of the code is simply copying stuff out of the Java objects into simple CFML data bits. Here is part of the output:

As I said, you could do some nice stuff with this data. So for example, what if we take the numbers of CRUD operations per entity and chart them - again with the idea being we may want to know what entity gets the most traffic:
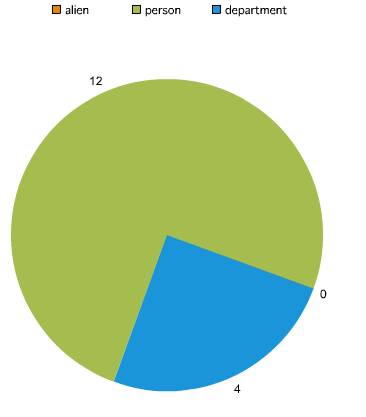
Useful, right? Now - I'm assuming that these stats add a bit of overhead to your application. None of the factory stats worked until I explicitly turned them on. But you could use it during load testing, or during special times of the month, and then disable it again later on. Anyway, I hope this is useful for folks!
p.s. So - I mentioned that I ran into trouble using this with the debug template. What problems did I have? You can't do anything at all with the current session. It seems to be closed prior to the debug template being run. You can still get the factory stats, which as you can see our pretty stellar, but for per request data, you are out of luck.