ColdFusion Charting - Y Axis Titles and Dashed Lines
Joe asks a few questions about ColdFusion Charting:
Per you instruction on how to add a second Y-axis to a CF chart, I'd like to know what is the attribute to use to specify a title for the second Y-axis.In addition I would like to have in some cases, dashed lines in my line charts, but cannot find the attribute to control this feature.
Also, where does one find reference material on the available style attributes to use in an xml file that will control style in a ColdFusion chart? I have searched extensively for this information, but it seems that is does not exist. Thank you for any information you can provide.
No problem Joe, let's tackle this question by question. First, the blog post about a second y-axis can be found here: Ask a Jedi: Two Y Axis for ColdFusion Charts. In that post, the solution was to use XML that told the chart to treat the Nth series (charting is 0 based) as a second Y Axis. To set the title for the second Y Axis requires new XML:
<frameChart is3d="false">
<elements place="Default" shape="Line" drawShadow="true">
<series index="0" shape="Line" isSecondAxis="true"/>
</elements>
<yAxis><titleStyle>Moo</titleStyle></yAxis>
<yAxis2><titleStyle>Zoo</titleStyle></yAxis2>
</frameChart>
In this example I've provide a title for both Y Axises, but ColdFusion provides a native way to set the first Y Axis title.
Now for the next question - dashed lines. This was a bit trickier. I loaded up the chart editor and selected a line chart. I expanded Elements and then Series. Note the screen shot:
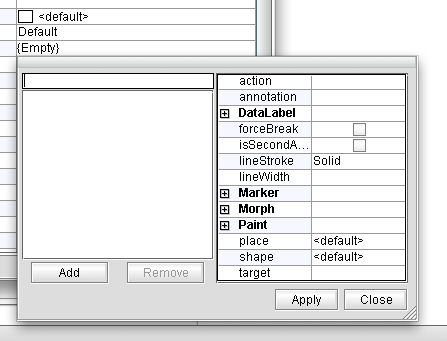
This is very important. You can see line stroke right there - and you can change it to Dashed or Dotted. However - if you hit Apply, nothing changes. Why? You have to explicitly specify what series you want first. I entered 0 in the left hand text input:
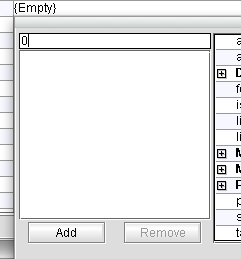
And then I hit Add. Now when I select Dashed for lineStroke and hit Ok, I can see this in the chart editor:
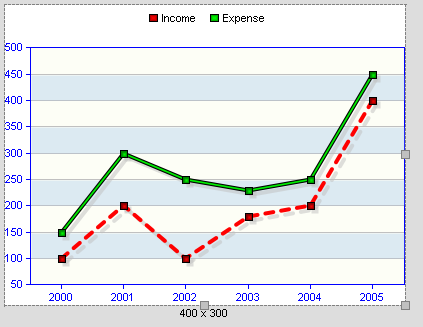
The relevant XML then is just:
<elements place="Default" shape="Line" drawShadow="true">
<series index="0" lineStroke="Dashed"/>
</elements>
So, going back to the original example from the last blog entry, I can modify that original
<cfset q = queryNew("year,sales","integer,integer")>
<!--- generate random sales data --->
<cfloop index="y" from="1994" to="1998">
<cfscript>
queryAddRow(q);
querySetCell(q, "year", y);
querySetCell(q, "sales", randRange(80,220));
</cfscript>
</cfloop>
<cfdump var="#q#">
<cfset q2 = queryNew("year,employees","integer,integer")>
<!--- generate random sales data --->
<cfloop index="y" from="1994" to="1998">
<cfscript>
queryAddRow(q2);
querySetCell(q2, "year", y);
querySetCell(q2, "employees", randRange(2,8));
</cfscript>
</cfloop>
<cfdump var="#q2#">
<!--- style from webcharts --->
<cfsavecontent variable="style">
<?xml version="1.0" encoding="UTF-8"?>
<frameChart is3d="false">
<elements place="Default" shape="Line" drawShadow="true">
<series index="0" shape="Line" isSecondAxis="true" lineStroke="dashed" />
</elements>
<yAxis><titleStyle>Moo</titleStyle></yAxis>
<yAxis2><titleStyle>Zoo</titleStyle></yAxis2>
</frameChart>
</cfsavecontent>
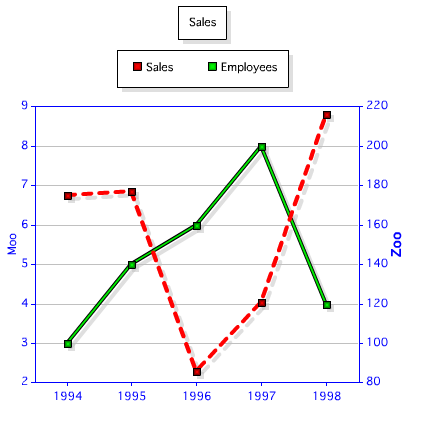
<cfchart chartWidth="400" chartHeight="400" title="Sales" style="#style#">
<cfchartseries type="line" query="q" itemColumn="year" valueColumn="sales" serieslabel="Sales" />
<cfchartseries type="line" query="q2" itemColumn="year" valueColumn="employees" seriesLabel="Employees" />
</cfchart>
And the result (sans dumps):
So as to Joe's last question - as already described above - I'm using the Chart Editor. This is a Java application that ships with ColdFusion (including ColdFusion 9). You can find the executable (it is a BAT file for Windows a sh file Linux/OSX) within the charting folder under your ColdFusion install. The basic procedure is to use the editor to tweak the chart to your liking and then copy the XML created.