Ask a Jedi: Two Y Axis for ColdFusion Charts
Danny asks:
I basically want to know if it's possible to have two different y-axis units/values and title? Let's say series #1 is random from 1-10 and then series #2 is random from 1000-10000. If you put those two series onto the same graph having only one y-axis, then the first series will not be readable. So, left y-axis would feature the first series and the right y-axis would feature the second series.
I have to admit - I wasn't sure what he meant at first. Then he provided a nice sample graph:
 This made sense to me. Basically he has two sets of data with different ranges of Y values. Danny said he tried the chart editor, which as my readers know is the first place I always suggest folks to look. I tried as well and like Danny, I wasn't able to get it working. I did some quick Googling and came across this example. I played around with the source code, did some tests back in the chart editor, and finally figured it out.
In the style XML you can define a series as using a different y axis. For example:
<elements place="Default" shape="Line" drawShadow="true">
<series index="0" shape="Line" isSecondAxis="true"/>
</elements>
This says that the first series (remember, it is 0 based, since lord forbid people start counting with 1 like sane folks) represents the second axis. The shape should match the type of graph you want of course. You can use index="1" to specify the second series as well.
Ok, so let's do a demo. First, I'll create two queries of data:
<cfset q = queryNew("year,sales","integer,integer")>
<!--- generate random sales data --->
<cfloop index="y" from="1994" to="1998">
	<cfscript>
	queryAddRow(q);
	querySetCell(q, "year", y);
	querySetCell(q, "sales", randRange(80,220));
	</cfscript>
</cfloop>
<cfset q2 = queryNew("year,employees","integer,integer")>
<!--- generate random sales data --->
<cfloop index="y" from="1994" to="1998">
	<cfscript>
	queryAddRow(q2);
	querySetCell(q2, "year", y);
	querySetCell(q2, "employees", randRange(2,8));
	</cfscript>
</cfloop>
The first query represents sales figures over a 5 year period. The second query represents how many employees they had during those years.
Next up is the XML I'll use for the style:
<!--- style from webcharts --->
<cfsavecontent variable="style">
<?xml version="1.0" encoding="UTF-8"?>
<frameChart is3d="false">
<elements place="Default" shape="Line" drawShadow="true">
<series index="0" shape="Line" isSecondAxis="true"/>
</elements>
</frameChart>
</cfsavecontent>
Notice there my elements and series tags. Now lets render the charts:
<cfchart chartWidth="400" chartHeight="400" title="Sales" style="#style#">
	<cfchartseries type="line" query="q" itemColumn="year" valueColumn="sales" serieslabel="Sales" />
	<cfchartseries type="line" query="q2" itemColumn="year" valueColumn="employees" seriesLabel="Employees" />
</cfchart>
The important thing to note is that the first chart series, sales, is what will be on the right side of the chart. Here is the result:
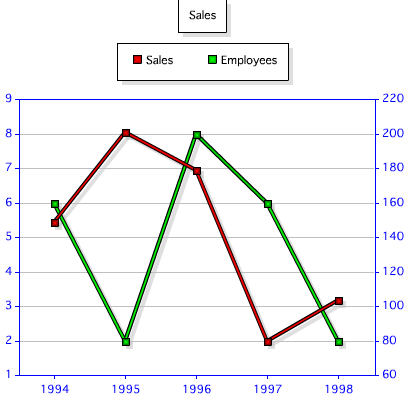
There ya go. Hope this helps others, and here is the complete template if folks want to quickly test it.
<cfset q = queryNew("year,sales","integer,integer")>
<!--- generate random sales data --->
<cfloop index="y" from="1994" to="1998">
	<cfscript>
	queryAddRow(q);
	querySetCell(q, "year", y);
	querySetCell(q, "sales", randRange(80,220));
	</cfscript>
</cfloop>
<cfdump var="#q#">
<cfset q2 = queryNew("year,employees","integer,integer")>
<!--- generate random sales data --->
<cfloop index="y" from="1994" to="1998">
	<cfscript>
	queryAddRow(q2);
	querySetCell(q2, "year", y);
	querySetCell(q2, "employees", randRange(2,8));
	</cfscript>
</cfloop>
<cfdump var="#q2#">
<!--- style from webcharts --->
<cfsavecontent variable="style">
<?xml version="1.0" encoding="UTF-8"?>
<frameChart is3d="false">
<elements place="Default" shape="Line" drawShadow="true">
<series index="0" shape="Line" isSecondAxis="true"/>
</elements>
</frameChart>
</cfsavecontent>
<cfchart chartWidth="400" chartHeight="400" title="Sales" style="#style#">
<cfchartseries type="line" query="q" itemColumn="year" valueColumn="sales" serieslabel="Sales" />
<cfchartseries type="line" query="q2" itemColumn="year" valueColumn="employees" seriesLabel="Employees" />
</cfchart>