Stupid CFCHART Trick of the Week
Earlier yesterday morning I blogged about cfchart and a poster asked an interesting followup question:
His name was Magnus, and there was no way I could ignore a question from someone with a cool name like that. First let me demonstrate what he is talking about. I created some data that represented books and their ranks over a five week period:I have another cfchart question (Maybe I am cheating by tacking it on here). I tried to chart some data based on ranked lists, like a bestseller list. I wanted to chart the position of a "book" on the list over the weeks. On the list, 1 is higher than 2 is higher than 10, so when it charted it came out upside down. I didn't see anything in the cfchart attributes that allowed me to invert this.
I have to admit, it wasn't a crucial need to chart this so I moved on to other problems, but it has sort of bugged me since then. Was I missing something easy?
<cfscript>
function addIt(week,book,position) {
	queryAddRow(data);
	querySetCell(data, "week", arguments.week);
	querySetCell(data, "book", arguments.book);
	querySetCell(data, "position", arguments.position);
}
data = queryNew("week,book,position","integer,varchar,integer");
addIt(1,"Alpha",1);
addIt(2,"Alpha",2);
addIt(3,"Alpha",1);
addIt(4,"Alpha",4);
addIt(5,"Alpha",5);
addIt(1,"Beta",3);
addIt(2,"Beta",1);
addIt(3,"Beta",2);
addIt(4,"Beta",2);
addIt(5,"Beta",1);
addIt(1,"Gamma",5);
addIt(2,"Gamma",4);
addIt(3,"Gamma",3);
addIt(4,"Gamma",1);
addIt(5,"Gamma",2);
</cfscript>
The UDF is there simply to save me some typing. I then created the chart:
<cfchart show3d="false" >
	<cfloop index="book" list="#valueList(data.book)#">
		<cfquery name="weekdata" dbtype="query">
		select	*
		from	data
		where	book = <cfqueryparam cfsqltype="cf_sql_varchar" value="#book#">
		order by week
		</cfquery>
		<cfchartseries type="line" query="weekdata" itemcolumn="week" valuecolumn="position" serieslabel="#book#">
	</cfloop>
</cfchart>
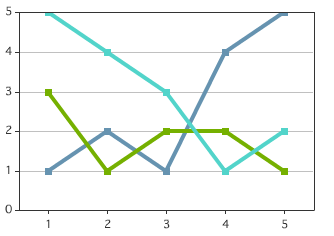
The result is a bit hard to read in static JPG format, but has nice roll overs in Flash. When I used a legend, it got a bit screwy. I'll come back to that. But as you can see, the grid starts with lower numbers first:
Once again I turned to the handy dandy chart editor. After a bit of clicking I finally found what I wanted under YAxis (duh). Clicking on this setting gives you a lot of options for the YAxis, including a "Is Reversed" tick. The resulting XML gives you:
<frameChart is3D="false">
          <yAxis isReversed="true">
          </yAxis>
		<legend isVisible="false" showColumnLegend="false">
               <decoration style="None"/>
          </legend>
</frameChart>
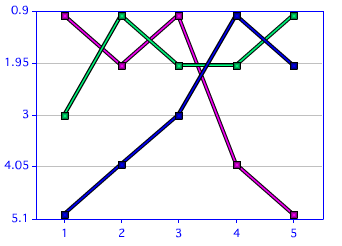
Note - I did tweak a bit more, like turning off the column legend which was turned back on by the XML. This gives you the result you want - kinda:

As you can see, we still have a range of 1-5. I tried like heck to fix this. There is even a range option in the chart editor, but the data seems to override this. You can supply a gridlines of 5. That does give you the right number of lines, but check out the result:
Not what I'd call optimal, but I'll take a look at this a bit more later to see if I can figure this last step out. Here is the complete code of the latest version:
<cfscript>
function addIt(week,book,position) {
queryAddRow(data);
querySetCell(data, "week", arguments.week);
querySetCell(data, "book", arguments.book);
querySetCell(data, "position", arguments.position);
}
data = queryNew("week,book,position","integer,varchar,integer");
addIt(1,"Alpha",1);
addIt(2,"Alpha",2);
addIt(3,"Alpha",1);
addIt(4,"Alpha",4);
addIt(5,"Alpha",5);
addIt(1,"Beta",3);
addIt(2,"Beta",1);
addIt(3,"Beta",2);
addIt(4,"Beta",2);
addIt(5,"Beta",1);
addIt(1,"Gamma",5);
addIt(2,"Gamma",4);
addIt(3,"Gamma",3);
addIt(4,"Gamma",1);
addIt(5,"Gamma",2);
</cfscript>
<cfsavecontent variable="style">
<frameChart is3D="false">
<yAxis isReversed="true">
</yAxis>
<legend isVisible="false" showColumnLegend="false">
<decoration style="None"/>
</legend>
</frameChart>
</cfsavecontent>
<cfchart show3d="false" style="#style#" gridlines="5">
<cfloop index="book" list="#valueList(data.book)#">
<cfquery name="weekdata" dbtype="query">
select	*
from	data
where	book = <cfqueryparam cfsqltype="cf_sql_varchar" value="#book#">
order by week
</cfquery>
<cfchartseries type="line" query="weekdata" itemcolumn="week" valuecolumn="position" serieslabel="#book#">
</cfloop>
</cfchart>