Ask a Jedi: CFCHART Question
Frank asks:
I have a question about how to use ColdFusion Chart.
I get data from a database table and wanted to show it on the chart. A typical data would be like this:
NAME             MONTH          COST
----------------------------------------
name1            2                 100
name1            3                 80
name2            1                 60
name3            2                 30
----------------------------------------
I would like to use name on X-axis and cost as Y-axis on a barchart. However, since I have two records of name1. There is only one name1 showing up. Do you have any experience of fixing this problem?
First off - what you really have here isn't one simple set of data, but a series of data. For each month, you have a set of users and sales. CFCHART supports multiple series of data per chart, so right away we can support exactly what you want. However you will run into a little issue when you try to use your data. Let me show you the code first, then I'll show you how I fixed it.
First off, I create a query of data:
<cfset data = queryNew("name,month,cost")>
<cfset queryAddRow(data)>
<cfset querySetCell(data,"name", "Name1")>
<cfset querySetCell(data,"month", "2")>
<cfset querySetCell(data,"cost", "100")>
<cfset queryAddRow(data)>
<cfset querySetCell(data,"name", "Name1")>
<cfset querySetCell(data,"month", "3")>
<cfset querySetCell(data,"cost", "80")>
<cfset queryAddRow(data)>
<cfset querySetCell(data,"name", "Name2")>
<cfset querySetCell(data,"month", "1")>
<cfset querySetCell(data,"cost", "60")>
<cfset queryAddRow(data)>
<cfset querySetCell(data,"name", "Name3")>
<cfset querySetCell(data,"month", "2")>
<cfset querySetCell(data,"cost", "30")>
I know that my series will be by month, so I then ask for all the distinct months:
<!--- get months --->
<cfquery name="getMonths" dbtype="query">
select	distinct [month]
from	data
order by [month] asc
</cfquery>
Notice I escape month since it is a reserved word in query of query. Now I create my chart:
<cfchart title="Sales" show3d="true" showLegend="true">
	<cfloop query="getMonths">
		<cfquery name="databymonth" dbtype="query">
		select	*
		from	data
		where	[month] = <cfqueryparam cfsqltype="cf_sql_integer" value="#month#">
		</cfquery>
		<cfchartseries type="bar" itemColumn="name" valueColumn="cost" query="databymonth" seriesLabel="Sales for Month #month#">
		</cfchartseries>
	</cfloop>
</cfchart>
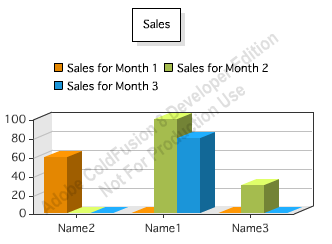
Notice that I loop over my getMonths query, and for each month, I get a set of data for that month. I then supply that query to the chartseries tag. So far so good, but what happens when you view the chart?

That can't be right. In cases where we don't have data, the bars don't match at all. Unfortunately, I've seen this before. The cfchart support in ColdFusion sometimes seems to get confused by missing values. The only way to fix this is to 'complete' the data and ensure you always have a value for each month and each user. This could be done in SQL, but since my data was fake, I fixed it manually like so:
<cfloop query="getMonths">
	<cfset thisMonth = month>
	<cfloop query="getNames">
		<!--- do we have data for name X on month Y? --->
		<cfquery name="hasData" dbtype="query">
		select	cost
		from	data
		where	[month] = <cfqueryparam cfsqltype="cf_sql_integer" value="#thisMonth#">
		and		name = <cfqueryparam cfsqltype="cf_sql_varchar" value="#name#">
		</cfquery>
		<cfif hasData.recordCount is 0>
			<cfset queryAddRow(data)>
			<cfset querySetCell(data,"name", name)>
			<cfset querySetCell(data,"month", thisMonth)>
			<cfset querySetCell(data,"cost", "0")>
		</cfif>
	</cfloop>
</cfloop>
When run, we now get the correct chart:
And lastly, here is the complete template.
<cfset data = queryNew("name,month,cost")>
<cfset queryAddRow(data)>
<cfset querySetCell(data,"name", "Name1")>
<cfset querySetCell(data,"month", "2")>
<cfset querySetCell(data,"cost", "100")>
<cfset queryAddRow(data)>
<cfset querySetCell(data,"name", "Name1")>
<cfset querySetCell(data,"month", "3")>
<cfset querySetCell(data,"cost", "80")>
<cfset queryAddRow(data)>
<cfset querySetCell(data,"name", "Name2")>
<cfset querySetCell(data,"month", "1")>
<cfset querySetCell(data,"cost", "60")>
<cfset queryAddRow(data)>
<cfset querySetCell(data,"name", "Name3")>
<cfset querySetCell(data,"month", "2")>
<cfset querySetCell(data,"cost", "30")>
<!--- get months --->
<cfquery name="getMonths" dbtype="query">
select	distinct [month]
from	data
order by [month] asc
</cfquery>
<!--- Begin Fixing Data --->
<cfquery name="getNames" dbtype="query">
select	distinct name
from	data
order by name asc
</cfquery>
<cfloop query="getMonths">
<cfset thisMonth = month>
<cfloop query="getNames">
<!--- do we have data for name X on month Y? --->
<cfquery name="hasData" dbtype="query">
select	cost
from	data
where	[month] = <cfqueryparam cfsqltype="cf_sql_integer" value="#thisMonth#">
and		name = <cfqueryparam cfsqltype="cf_sql_varchar" value="#name#">
</cfquery>
<cfif hasData.recordCount is 0>
<cfset queryAddRow(data)>
<cfset querySetCell(data,"name", name)>
<cfset querySetCell(data,"month", thisMonth)>
<cfset querySetCell(data,"cost", "0")>
</cfif>
</cfloop>
</cfloop>
<cfchart title="Sales" show3d="true" showLegend="true">
<cfloop query="getMonths">
<cfquery name="databymonth" dbtype="query">
select	*
from	data
where	[month] = <cfqueryparam cfsqltype="cf_sql_integer" value="#month#">
</cfquery>
<cfchartseries type="bar" itemColumn="name" valueColumn="cost" query="databymonth" seriesLabel="Sales for Month #month#">
</cfchartseries>
</cfloop>
</cfchart>