Adding a Web Debugger to BoxLang (First Version)

This one's been sitting in my "to do" blog queue for sometime now and I figured the beginning of spooky season (September 1 - don't we all start celebrating Halloween then?) was a good excuse to finally kick this out the door. Many, many years ago I learned to love one of the simpler features of ColdFusion, the debugging output. This is a feature ColdFusion has probably had for near twenty or so plus years and while it's not the same as a "full" debugging service (which also exists), or the powerhouse Fusion Reactor, it's an incredibly simple way to look at what's going on in your web application.
It works by first enabling it (something you would do in your admin and in development only of course) and tweaking the settings. Once enabled, it will print a large set of debug information at the end of very web page. How and what's printed depends on your settings, but it will show things like:
- Database queries, including the SQL, number of results, and how long the query ran
- Method executions of components (think classes) and how long they took
- Template timings as well
- Variables used
- Any exceptions thrown in the request
This information can be incredibly useful in terms of not only finding performance issues but also just realizing what in the heck's actually going on in any one particular request.
While useful, this feature of ColdFusion is a bit of a black box. In the past, you could actually build your own debugging templates with modifications to suit your needs, but when I checked recently, that was no longer possible unfortunately.
As an example of how this could look, I've got a very simple web page here that's including a very slow page, and you can see it flagged in the debug output (after the <hr>).
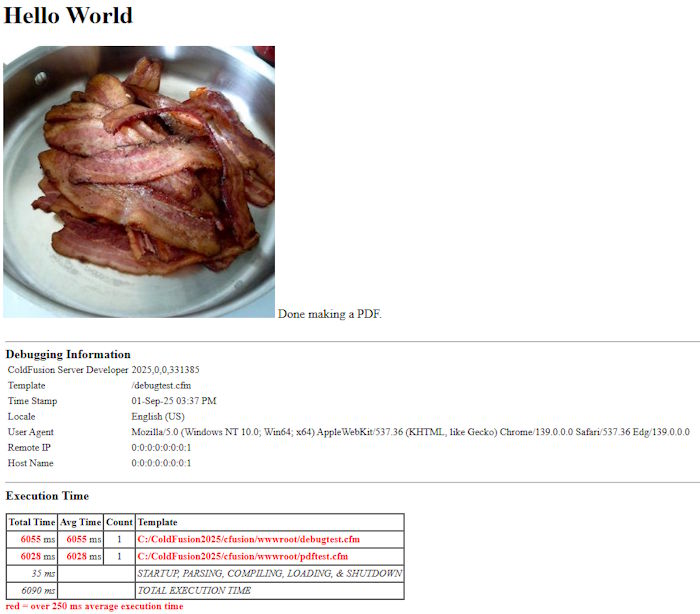
In this case, the main template took 6055 total ms, but the included template took 6028 ms, so it's plain to see that's the culprit for the slowness of the page. There's a lot more that be shown here, but this is all I had ready to put on a screen shot.
So can we do this in BoxLang? Sure!
The BoxLang Version
In order to support something like this in BoxLang, I looked at two features - the module system which lets you add to BoxLang itself and interceptors which let you tie into the platform at a low level.
My initial version of this project (I've got plans - big plans - and will detail at the bottom) support reporting the following metrics:
- Each template used in the request and their execution time.
- Each database query including the number of records returned and execution time.
- HTTP calls including the size of the response and execution time.
In terms of how this is rendered, I did it a bit differently than ColdFusion. My debug module adds two new BIFs (built-in function). The first, debugDisplay(), will render out the debug information wherever you call it. So for example, you can include it in every request like so:
public function onRequestEnd(required string path) {
	debugDisplay();
}
You probably don't want it like this, but it's a quick and dirty way to add it in. As an example, this renders like so:
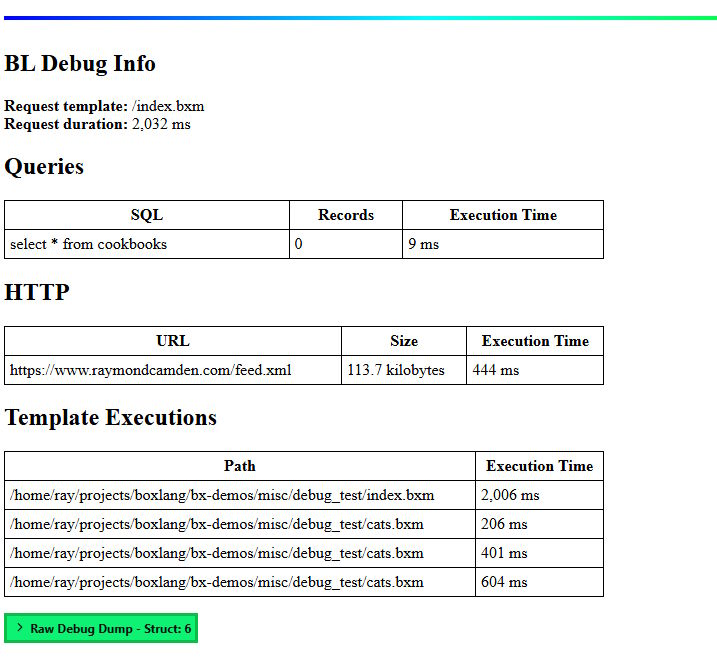
I don't yet have "flag slow things with red" added, but that's coming. I instead spent my time on the nice rainbow rule as that was definitely more important.
In the sample, note how it shows the file, cats.bxm, being included 3 times. Right away that should concern a developer as it may be a mistake. But then also notice how each time it's executed, it takes longer to run. Again, another possible issue. It's stuff like this that the CF debugging template was great at exposing and is what inspired me when building this in BoxLang.
That's the "pretty" version, but you also get a function, getDebugInfo(), that returns all of this data and lets you do whatever you want. You could save it to a log file, store it in a database, or do your own checks ("If I see a request to an external domain, flag it.")
How's It Built
At a high level, this proof of concept starts off as a module. I built it locally into a simple web app by adding a boxlang_modules folder, and under that, a folder named debug. The first file is the ModuleConfig.bx class which defines how the module acts - in my case, specifying interceptors:
class {

	property name="moduleRecord";
	property name="boxRuntime";

	this.version = "0.0.1";
	this.author = "Raymond Camden";
	this.description = "Adds debug output support to BoxLang web apps.";
	this.webURL = "https://github.com/cfjedimaster/bx-debug";

	function configure() {

		interceptors = [
			{ class='#moduleRecord.invocationPath#.interceptors.debuginterceptor' }
		];
	}
}
This class is basically just metadata with the important line in configure specifying what interceptors to add to the runtime. Let's look at that:
import ortus.boxlang.runtime.context.RequestBoxContext;

class {

	private function getDebug() {
		/*
		println(getBoxContext().getClass().name);
		requestContext = getBoxContext().getRequestContext();
		Removed due to bug
		*/
		requestContext = RequestBoxContext.getCurrent();

		return requestContext.computeAttachmentIfAbsent( "debug", ()->structNew() );
	}

	public function onRequestStart(data) {
		debugData = getDebug();
		debugData.requestStarted = getTickCount();
		debugData.requestTemplate = data.args[1];

		debugData.queries = [];
		debugData.http = [];

		debugData.templateStack = [];
	}

	public function onRequestEnd() {
		debugData = getDebug();
		debugData.requestTotal = getTickCount() - debugData.requestStarted;

	}

	public function postQueryExecute(data) {
		debugData = getDebug();

		debugData.queries.append({
			sql:data.sql,
			executionTime:data.executionTime,
			records:data.result.recordCount
		});

	}

	public function onHTTPResponse(data) {

		debugData = getDebug();
		debugData.http.append({
			executionTime:data.result.executionTime,
			url:data.result.request.url.toString(),
			size:data.result.fileContent.len()
		});

	}

	public function preTemplateInvoke(data) {
		debugData = getDebug();
		path = data.templatePath.absolutePath().toString();
		debugData.templateStack.append({
			path:path,
			started:getTickCount()
		});
	}

	public function postTemplateInvoke(data) {
		debugData = getDebug();

		path = data.templatePath.absolutePath().toString();
		/*
		traverse up my stack until path match and set ended to now
		*/
		for(i=debugData.templateStack.len();i>0;i--) {
			if(debugData.templateStack[i].path == path && !debugData.templateStack[i].keyExists('ended')) {
				debugData.templateStack[i].ended = getTickCount();
			}
		}
	}

}
Alright, this one's pretty complex. When you define a class of interceptors, BoxLang will look for methods that match recognized interceptors (see the docs for the full list)) and automatically connect them to the runtime. So for example, postQueryExecute will be called after every single database query. onHTTPResponse will be called whenever your code makes a HTTP request. (Note that I just now found a bug with this, remote images loaded via the Image module aren't calling this interceptor. I've reported it.)
That's the interceptors - the data is a bit interesting. The getDebug function does two things. First, it gets the current execution context of the request. I'll be honest and say I only kinda get that. I've got Brad Wood to thank for that. The next part is cool. I'm basically "attaching" my own space, debug, to the context. This lets me create and use ad hoc data that does not impact the data of the actual request. I.e., I don't "pollute" the variable space of my application, but rather kinda tag along for the ride in my own little toy box.
All of my interceptors use this attachment as a way to store data, record timings, and so forth.
That's basically it, but there's more I can do, and I'll talk about that in a bit. The next part of the module are the two BIFs that are added to the server. This is done using the bifs folder and creating one file per function. The big one is debugDisplay.bx:
@BoxBIF
class {

	/*
	copied from the interceptor - consider migrating to one place
	*/
	private function getDebug() {
		requestContext = getBoxContext().getRequestContext()
		return requestContext.computeAttachmentIfAbsent( "debug", ()->structNew() )
	}

	function init() {
	}

	function formatBytes(bytes) {
		units = ['byte', 'kilobyte', 'megabyte', 'gigabyte', 'terabyte'];
		i = floor(log(bytes) / log(1024));
		value = bytes / 1024^i;

		return numberFormat(value) & " #units[i+1]##value>1?'s':''#";
	}

    function invoke() {
		debug = getDebug();

		bx:saveContent variable="html" {
		```
		<style>
		div#debugModule {

			hr {
				margin: 30px 0;
				border: 0;
				height: 4px;
				background: #ff0000;
				background: linear-gradient(-45deg, #ff0000 0%,#ffff00 25%,#00ff00 50%,#00ffff 75%,#0000ff 100%);
			}

			table {
				border-collapse: collapse;
				border: 1px solid black;
				width: 100%;
				max-width: 600px;
			}

			th, td {
				border: 1px solid black;
				padding: 5px;
			}
		}
		</style>

		<div id='debugModule'>
		<hr>
		<h2>BL Debug Info</h2>

		<bx:output>
		<p>
		<strong>Request template:</strong> #debug.requestTemplate#<br>
		<strong>Request duration:</strong> #numberFormat(debug.requestTotal)# ms<br>
		</p>
		</bx:output>

		<h2>Queries</h2>

		<bx:if debug.queries.len() gt 0>
			<table>
			<thead>
			<tr><th>SQL</th><th>Records</th><th>Execution Time</tr>
			</thead>
			<tbody>

			<bx:loop item="q" array="#debug.queries#">
				<bx:output>
					<tr>
						<td>#q.sql#</td><td>#q.records#</td><td>#numberFormat(q.executionTime)# ms</td>
					</tr>
				</bx:output>
			</bx:loop>
			</tbody>
			</table>
		<bx:else>
		<p>No database activity.</p>
		</bx:if>

		<h2>HTTP</h2>

		<bx:if debug.http.len() gt 0>
			<table>
			<thead>
			<tr><th>URL</th><th>Size</th><th>Execution Time</tr>
			</thead>
			<tbody>

			<bx:loop item="q" array="#debug.http#">
				<bx:output>
					<tr>
						<td>#q.url#</td><td>#formatBytes(q.size)#</td><td>#numberFormat(q.executionTime)# ms</td>
					</tr>
				</bx:output>
			</bx:loop>
			</tbody>
			</table>
		<bx:else>
		<p>No HTTP activity.</p>
		</bx:if>
		<h2>Template Executions</h2>

		<table>
		<thead>
		<tr><th>Path</th><th>Execution Time</th></tr>
		</thead>
		<tbody>

		<bx:loop item="t" array="#debug.templateStack#">
			<bx:output>
				<tr>
					<td>#t.path#</td><td>#numberFormat(t.ended-t.started)# ms</td>
				</tr>
			</bx:output>
		</bx:loop>

		</tbody>
		</table>

		</div>
		```
		};

		writeOutput(html);

		// may remove
		writeOutput("<p>");
		writedump(var=debug,expand=false,label="Raw Debug Dump");

    }

}
Basically - get the debug data and render out the various tables and such. I'm using a large tag island to make working with HTML in script a bit easier. Notice that it's in invoke, which is the method run when a user calls my contributed function. The getDebugData BIF is a lot smaller:
@BoxBIF
class {

	private function getDebug() {
		requestContext = getBoxContext().getRequestContext()
		return requestContext.computeAttachmentIfAbsent( "debug", ()->structNew() )
	}

    function invoke() {
		return getDebug();
    }

}
I could probably move that getDebug wrapper out as I've got it repeated three times, but that's for later.
As mentioned above, for my testing, I simply added debugDisplay() to my onRequestEnd method to show it at the bottom of my web pages.
What's Next
I want to play with this some more for sure, but on the top of my head, here's what I want to get added:
- First and foremost, I want to track calls to class methods. In my time building ColdFusion apps, most of my logic was encapsulated in CFC methods. I imagine the same will be true in BoxLang (although we call them classes over here). There is an interceptor for function calls, both before and after, and they're pretty powerful, but right now I can't get them working right so I've got some more digging to do. And by digging I mean nagging the BoxLang developers.
- I definitely want to add "use red for bad" type styling, which then brings me to my third issue...
- Allow for configuration so you can enable/disable features as well as configure when things should be flagged as 'bad'.
Want to try it yourself or contribute? Check out the repo here: https://github.com/cfjedimaster/bx-debug
Image by Andrew Martin from Pixabay