Graphing Movie Rating Distribution For No Good Reason

I'm on vacation this week (one of the benefits of working for Adobe are two shutdowns during the year) and haven't really had a chance to write a lick of code (been busy grinding levels in Black Ops multiplayer), but yesterday I found myself working on a small demo for no real important reason outside of just wanting to see what would happen. For folks outside of America, the MPA (formally the MPAA) is the Motion Picture Association. They're responsible for assigning ratings to movies released in America. There's a lot to be said about these ratings, and if you haven't seen it, I highly recommend "This Film is Not Yet Rated" as it details some of the hypocritical ratings giving out by the association.
I found myself on the web site for the ratings system, https://www.filmratings.com/, and discovered they had a search engine that let you find films for a particular year and rating. For example, here's the R movies released when I was born: https://www.filmratings.com/Search?filmYear=1973&filmRating=R&x=20&y=18
Being the kind of person I am, I opened up devtools in my browser and discovered the web site was hitting a SOAP based web service to get its data: https://www.filmratings.com/Filmratings_CARA/WebCaraSearch/Service.asmx
I love SOAP web services, and by love, I mean truly, truly hate. But I've dealt with them before ("Working with SOAP in a Node App") and I thought it would be interesting to see how the distribution of ratings varied over the years. I noticed that the web service returned a value representing the total number of films for a year and rating along with a page of data. The total would be enough for me. By playing with the web site, I discovered that the earliest data I could get was for 1968, and with that I whipped up a script that would gather totals for ratings from 1968 to 2020.
Note that the ratings themselves have changed over the years. For example, PG-13 was added in 1984. Some, like "GP", were removed. "X" was changed to "NC-17". For my script I decided to focus on the "common" ratings most people recognize.
I began with a simple script to get one year, one rating:
const soap = require('soap');
const apiWSDL = 'https://www.filmratings.com/Filmratings_CARA/WebCaraSearch/Service.asmx?WSDL';
const xml2js = require('xml2js');

(async () => {

	let year = 1968;
	let rating = 'G';

	let client = await soap.createClientAsync(apiWSDL);

	let result = await client.GetTitleListByYearRatingFullWithPaginationAsync({
		year: 1968,
		rating: 'G'
	});

	let parser = new xml2js.Parser();

	let xml = result[0]['GetTitleListByYearRatingFullWithPaginationResult'];
	//console.log(xml);
	let data = await parser.parseStringPromise(xml);
	let total = data.SearchResults.total_response[0];
	console.log(`There were ${total} ${rating} movies in ${year}`);

})();
Notice I'm using soap and xml2js packages. The soap package handles talking to the web sevvice and xml2js helps me parse the final result. Remember I'm only interested in the total, not the names of the movies. With this done, I then made the script a bit more generic:
const soap = require('soap');
const apiWSDL = 'https://www.filmratings.com/Filmratings_CARA/WebCaraSearch/Service.asmx?WSDL';
const xml2js = require('xml2js');
const parser = new xml2js.Parser();
let client;
const ratings = ['G', 'PG', 'PG-13', 'R', 'NC-17','X'];
const startYear = 1968;
const endYear = 2020;
const fs = require('fs');

const totalResult = [];

(async () => {

	for(let year=startYear; year <= endYear; year++) {
		let yearResult = { year, ratings:{} };
		for(let x=0; x < ratings.length; x++) {
			let rating = ratings[x];
			let total = await getTotal(year, rating);
			console.log(`There were ${total} ${rating} movies in ${year}`);
			yearResult.ratings[rating] = parseInt(total,10);
		}
		totalResult.push(yearResult);
	}

	fs.writeFileSync('./mparatings.json', JSON.stringify(totalResult), 'utf8');
	console.log('Wrote out the data.');

})();

async function getTotal(year, rating) {
	if(!client) client = await soap.createClientAsync(apiWSDL);
	let result = await client.GetTitleListByYearRatingFullWithPaginationAsync({
		year,
		rating
	});

	let xml = result[0]['GetTitleListByYearRatingFullWithPaginationResult'];
	//console.log(xml);
	let data = await parser.parseStringPromise(xml);
	let total = data.SearchResults.total_response[0];
	return total;
}
Notice I write out the results to a file. My thinking was that I'd do the "scrape" of the data once only. I didn't want to 'abuse' the API and hit it while I played with the results. Here's a subset of how the results look:
[
	{
		"year": 1968,
		"ratings": {
			"G": 181,
			"PG": 0,
			"PG-13": 0,
			"R": 49,
			"NC-17": 0,
			"X": 3
		}
	},
	{
		"year": 1969,
		"ratings": {
			"G": 175,
			"PG": 0,
			"PG-13": 0,
			"R": 77,
			"NC-17": 0,
			"X": 13
		}
	},
    // more years...
]
Cool. So at this point, I had all my data, I just needed to chart it. Since I can't seem to use the same client-side charting solution more than once in a row, I went with ApexCharts since it was free and came up when I searched for a stacked bar chart. I'll shate the code, but honestly I mostly just cut and pasted from their docs. Here's the HTML, which is just an empty div:
<html>
<head>
</head>


<body>

<div id="chart"></div>

<script src="https://cdn.jsdelivr.net/npm/apexcharts"></script>
<script src="mpa_app.js"></script>

</body>
</html>
And here's the code. Most of the work is in translating the data I made into a form that ApexCharts wants.
const ratings = ['G', 'PG', 'PG-13', 'R', 'NC-17','X'];

document.addEventListener('DOMContentLoaded', init, false);
async function init() {

	let req = await fetch('./mparatings.json');
	let data = await req.json();

	let allYears = data.map(d => {
		return d.year;
	});

	let series = [];
	data.forEach(d => {
		for(let rating in d.ratings) {
			let existingSeries = series.findIndex(d => {
				return d.name === rating;
			});
			if(existingSeries === -1) {
				series.push({name:rating, data:[]});
				existingSeries = series.length-1;
			}
			series[existingSeries].data.push(d.ratings[rating]);
		}
	});
	console.log(series);

	let options = {
		series,
		chart: {
			type: 'bar',
			height: '100%',
			stacked: true,
		},
		plotOptions: {
			bar: {
				horizontal: true
			},
		},
        stroke: {
          width: 1,
          colors: ['#fff']
        },
        title: {
          text: 'MPA Ratings by Years'
        },
        xaxis: {
          categories: allYears
        },
        yaxis: {
          title: {
            text: undefined
          },
        },
        fill: {
          opacity: 1
        },
        legend: {
          position: 'top',
          horizontalAlign: 'left',
          offsetX: 40
        }
	};

	let chart = new ApexCharts(document.querySelector("#chart"), options);
	chart.render();
}
And here's the result:
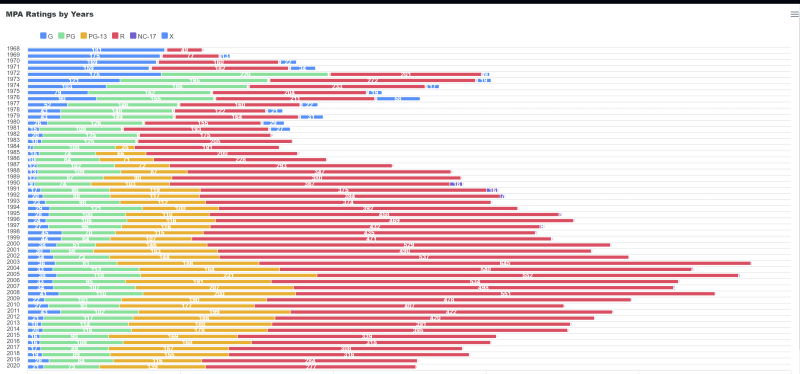
I realize that's too small to read. I put the web app itself up here: https://static.raymondcamden.com/demos/mpa/mpa.html If you've got any questions about this, hit me up!
Photo by Felix Mooneeram on Unsplash