
In my last article on FusionReactor, I talked about slow pages and how the tool helps you find them. In that article I specifically avoided talking about one of the biggest culprits of slow pages - database queries. My history with ColdFusion goes back to about version 2 and even back then database queries were the primary culprit in poorly performing applications.
There's multiple reasons why database queries can be a choke point for your application:
- A poor connection to the database.
- A poorly configurated database.
- A poorly configurated table.
- A poorly written query.
- And so forth.
In an ideal world, your organization has a DBA (database administrator) who tunes the database and tables and then crafts a beautiful SQL (or stored procedure) you can simply drop into your application. Unfortunately very few of us live in that ideal world. It's also very easy to simply ignore the problem. SQL, like any language, let's you get stuff done quickly and it can be easy to not consider the performance aspects of your query. Like any poorly written piece of code, a "slightly bad" query in a request can then be joined by another slightly bad one and slowly compound into a poorly performing page.
Being that database activity is such an important part of performance, it's no surprise FusionReactor has specific reporting tools focused on just that area. In this post I'm going to share what that looks like and share some examples of the kind of reports you can find.
JDBC Reports #
In my last post, I explained that JDBC stands for Java Database Connectivity. Any time you use a cfquery tag (or queryExecute function), you're making use of JDBC to allow your ColdFusion templates to speak to a database. Within FusionReactor, you'll want to start with the JDBC icon on the left:
Under here you've got a variety of options:
- JDBC Activity - i.e. what's going on right now.
- JDBC History - historical activity.
- JDBC Error History - past query errors.
- Activity Graph and Time Graph - a "live" graphical report of JDBC activity.
- Longest Transactions and Slowest Transaction - to be honest this was a bit confusing. Wouldn't the longest transaction also be the slowest transaction. The "Longest" report will show the transactions that have taken the longest to execute, no matter how long. The "Slowest" report is a report of all transactions over a particular threshold. So it may be possible that you have nothing there as your queries are performant, but the "Longest" report will still rank them for you.
- Trans. By Mem - reports on queries with high memory usage.
- Stack Trace Filter - it's possible that multiple different things are making use of your database. The stack trace filter lets you reduce the amount of "noise" you may get from other applications. By default there's filters set up for
.cfm,.cfc, and.jsp. - Databases - this gives a really cool report on how you're using your databases. I'll be sharing an example of this later.
- Settings - this is where you can configure how FusionReactor logs and monitors your database transactions
Examining Database Requests #
Let's take a look at how FusionReactor reports your database requests. First we'll open the "JDBC History" page. Remember that the first option shows a "live" version and unless your site is actively getting hits, you won't see anything.
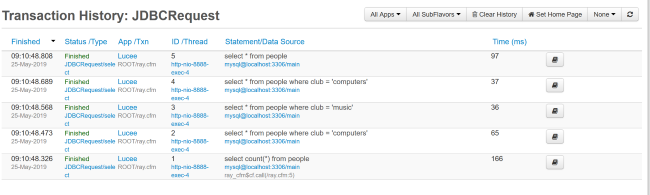
As with the previous examples I've shown from FusionReactor, take note of the controls on the top right allow for filtering, reloading, and so forth. What isn't obvious from the screen shot is that the "All SubFlavors" button actually lets you filter by the type of query, select, insert, and so forth. That's pretty neat.
The main table of data reports on the app that was being used (I'm just working in my default Lucee home directory) and the SQL that was used. You can see the file name as well as timing information. Note the Time column which shows you how long the particular query took.
Notice how the SQL is reported as well. One of the features of FusionReactor is to automatically replace queryparam values with their 'real' values when reporting on the query. You can enable or disable this feature under the "JDBC/Settings" page. While this is a cool feature, it means it's difficult to see where you've forgotten to use queryparams. I've reported to the FusionReactor folks that it would be nice if it was obvious when such a replacement has happened, maybe by using bold tags or some such. That way if you a query is not using queryparams it will be easier to find and correct.
The detail view is very deep. Here's the main tab of information:
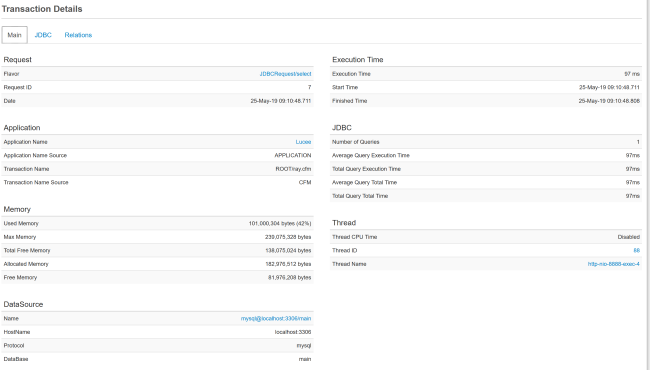
There is almost an overwhelming amount of information here, but I'd probably focus mostly on the execution time values under JDBC and the memory section. Here's the JDBC tab:
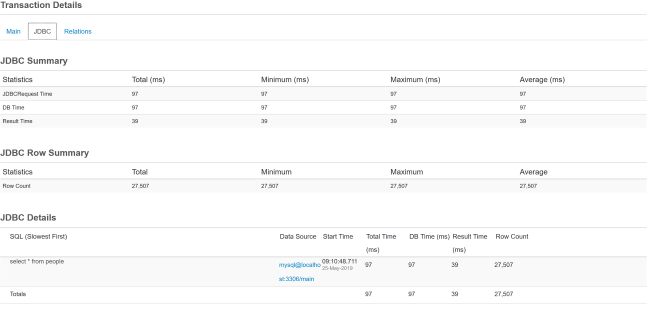
As before, there's a lot of information, but I'd focus in on the row count. If you've ever seen someone select everything from a table and then use ColdFusion conditionals to restrict what is shown, then you know why this is a problem. The query is returning a mind boggling twenty-seven thousand rows. There's no way that was intentional. (Ok, for my test it was, but you get my point.)
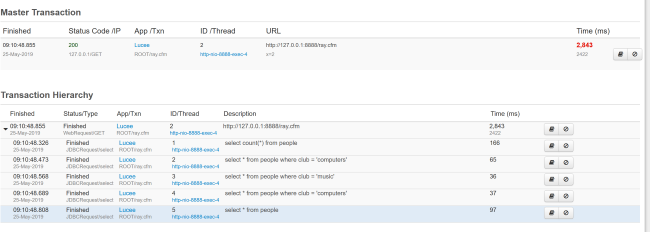
The final tab, Relations, gives you a good look at the query within the page it was working. For example, this page had multiple queries and you can see how they impacted to the overall total page performance.
Finding Query Errors #
Let's now take a look at how FusionReactor reports errors. To test, I ran two requests with simple SQL errors, one trying to get a field that didn't exist and one against a table that didn't exist. Here's how the main error history page shows the results.
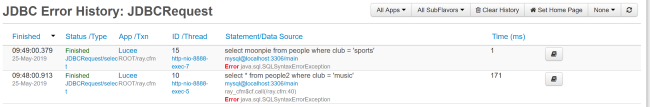
For the most part this is fairly similar to the history report, except now you can get a short report of the error. As a test, I shut down my MySQL server and ran my request again. As expected, I got an error. However, that error does not show up in this report. It does show up under "Request/Error History" though. My guess is that since Lucee couldn't ever speak to MySQL, a JDBC transaction was not made. That makes sense to me, but just keep in mind that you may want to check both error reports when hunting down issues.
The detail view is the same as before but with a new tab called "Error Details":
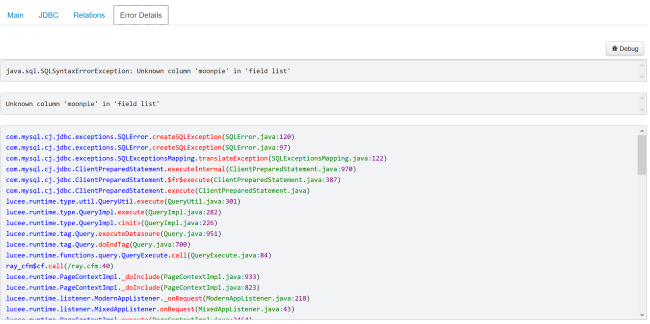
As always, I find the stack trace a bit hard to parse, but the error details on top seem nice and clear to me. Notice the debug button on the right. This allows you to add a breakpoint for future errors like this. I'm going to talk about FusionReactor's debugging features later.
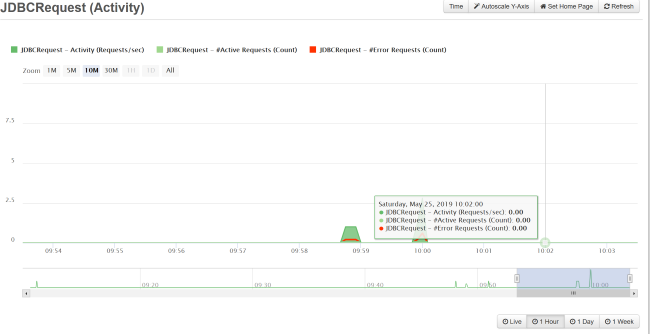
JDBC Graphs #
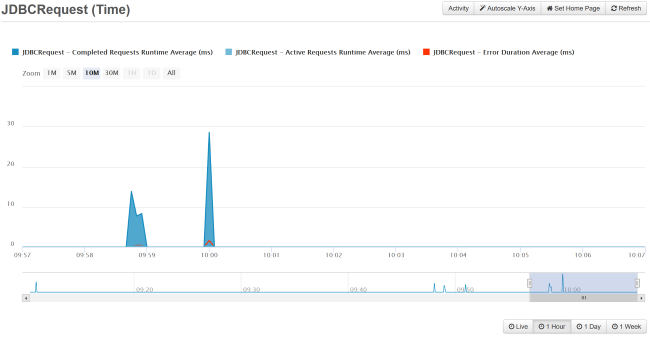
FusionReactor offers two reports of JDBC activities. The first is just raw activity (Activity Graph) while the second (Time Graph) reports on how long queries are taken. Both default to a "live" view but also let you look at specific time ranges. Here's an example of both, but note the graphs are a bit boring for me as this is just my local laptop.
Finding Those Bad Queries #
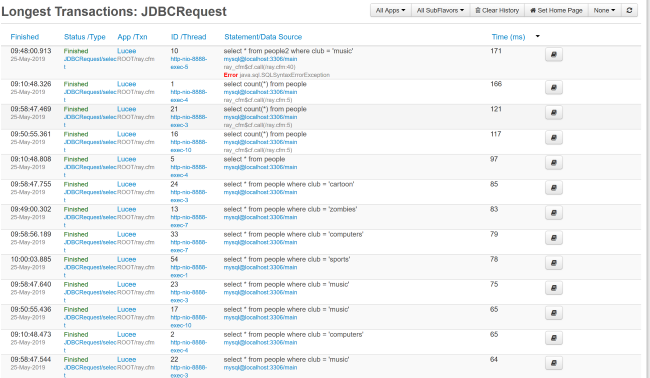
As I explained above, FusionReactor provides two reports to help you find slow queries. "Longest Transactions" will simply list out all your recorded transactions sorted by time. "Slowest Transactions" focuses on queries that are slower than a defined threshold. You can set that threshold in the settings panel, under "History". The default value is 3 seconds. There's quite a few interesting things you can tweak in the settings panel so I recommend taking a look at it. For my laptop, with again a simple test and not "real" data, here's the "Longest Transactions" view:
Your Database Use #
The final thing I want to show is probably the coolest. The "Databases" report gives you a report on how you are using each of the datasources on your server. It breaks it down by type of operations as well as table usage. It also reports on the queries sent to the datasource.
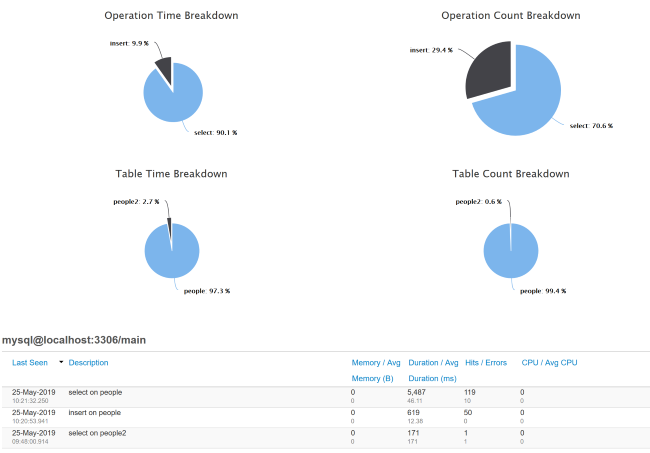
This is just freaking cool as heck to me. While I think most of us will deal with one database per server, larger more complex applications could be dealing with numerous databases. A report like this could help you figure out if one, or more, are perhaps being used rarely enough to be decommissioned or transitioned to one main database. The table report could be really useful too. I've dealt with projects hitting a database with a huge amount of tables. This can give you an idea of what's actually being used.
Summary #
As I said in the beginning, database issues tend to be the number one culprit when it comes to poorly performing ColdFusion sites. I think the JDBC set of features in FusionReactor will probably be your top tool for helping improve your applications. I know this is where I'd start looking!