Back a few months ago I reviewed the excellent SumAll service. One of the cooler parts of their service is a daily/weekly email summary of your stats. Here is a screen shot from my email this morning.
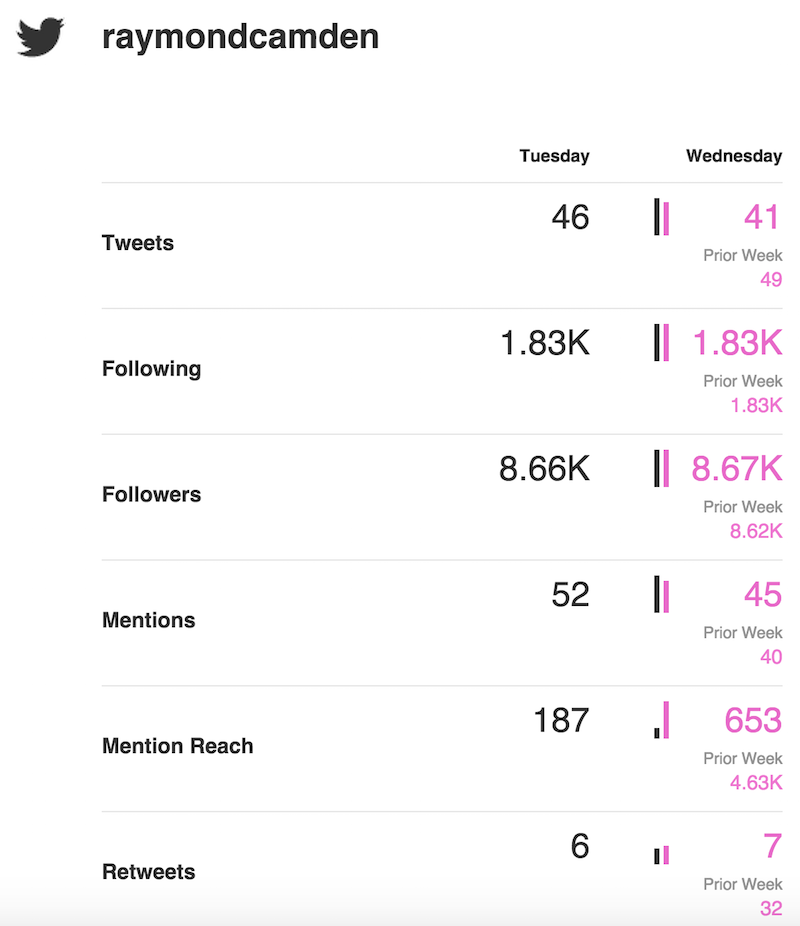
What I like about this are the simple bars between each number. They give you a real quick way to see your relative growth/drop from one day to the next. Like any good web developer, I was curious as to how they built this, so I right clicked, selected Inspect Element, and took a look at the code.
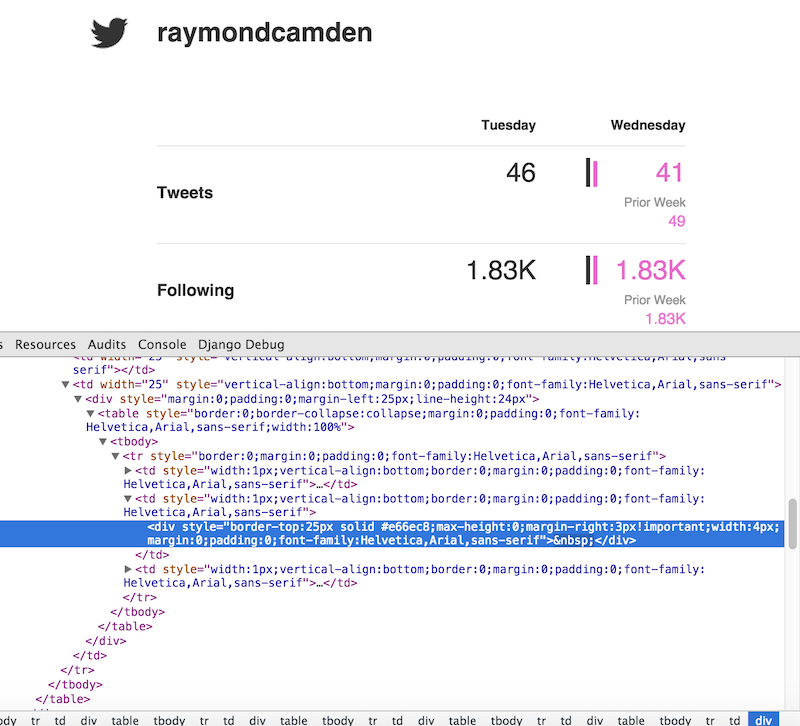
So - first off - there's a lot of markup to make this work. That isn't because the SumAll developers suck, it's simply a matter of life when dealing with HTML email. But the base mechanism isn't that difficult - a simple div with CSS. Obviously you could use one of the hundred or so different JS charting libraries out there, or Canvas, but why do all that when a bit of CSS is all you need.
I thought it would be interesting to try to replicate the look for a web page outside of email where I could use JavaScript to make it more dynamic. I began by creating a simple HTML page to represent a particular metric - the number of page views from last week and this week.
<!DOCTYPE html>
<html>
<head>
<meta charset="utf-8">
<title></title>
<meta name="description" content="">
<meta name="viewport" content="width=device-width">
</head>
<body>

<h2>Scores</h2>
<table>
	<tr>
		<th></th>
		<th>Last Week</th>
		<th></th>
		<th>This Week</th>
	</tr>
	<tr>
		<td>Page Views</td>
		<td><span id="pageviews_lw" data-raw="490121">490K</span></td>
		<td><span id="dobar"></span></td>
		<td><span id="pageviews_tw" data-raw="361902">362K</span></td>
	</tr>
</table>

</body>
</html>
There isn't anything particularly special about this layout, but note that I'm using a formatted number (490K) versus the real number (490121). I wanted it to be simpler to read for the end user. However, I know I'm going to need the real number, so I embed it in the HTML using a data property. (Off topic aside - but I freaking love data attributes. So simple, so practical!)
You can view this version of the page here: http://www.raymondcamden.com/demos/2015/mar/19/test1.html. Before we go any further - please actually view that link. It isn't pretty, but guess what? It works in every single browser known to humankind. Everything I do from now on will simply enhance the experience for people with JavaScript and more modern browsers. That's something we should all consider when adding interactivity/fancy UI/etc to our pages! (And to be fair, I'm guilty of not doing proper progressive enhancement as well.)
Ok, so let's build the next version. I began by modifying the dobar span to include a table to hold my bars. That may not be necessary, but I was mimicking what SumAll had built. I also included the CSS for each bar minus the portion that determined the height and the color. SumAll used black for the left side only, but I decided to use black for the 100% value and a different color for the other one. That just made more sense to me. This is the new HTML for the span:
<span id="dobar">
<table><tr style="vertical-align:bottom">
<td>
<div style="margin-right:3px!important;width:4px;"> </div>
</td><td>
<div style="margin-right:3px!important;width:4px;"> </div>
</td>
</tr></table>
</span>And now let's look at the JavaScript.
var BIG_COLOR = "#000";
var SMALL_COLOR = "#3cb4e7";

$(document).ready(function() {

	//get our numbers
	var pv_lw = $("#pageviews_lw").data("raw");
	var pv_tw = $("#pageviews_tw").data("raw");

	var biggest = Math.max(pv_lw, pv_tw);
	var smallest = Math.min(pv_lw, pv_tw);
	//so what perc of biggest is smallest?

	var perc = Math.floor((smallest / biggest)*100);
	//so biggest uses 30, perc determines other
	var smallerBar = Math.floor((perc/100)*30);

	//do left side
	var css_lw, css_nw;
	if(pv_lw == biggest) {
		css_lw = "30px solid "+BIG_COLOR;
		css_nw = smallerBar+"px solid "+SMALL_COLOR;
	} else {
		css_nw = "30px solid "+BIG_COLOR;
		css_lw = smallerBar+"px solid "+SMALL_COLOR;
	}

	$("span#dobar td:first-child div").css("border-top", css_lw);
	$("span#dobar td:last-child div").css("border-top", css_nw);

});
So really - it just comes down to math. Figure out the highest value, then the percentage difference for the other value. I used "30" to represent the highest bar so the other bar is a percentage of that. Then it is a simple matter of updating the CSS. Let me quickly thank Ian Devlin for his help finding a rookie mistake I made using jQuery.css. I had included a semicolon in the CSS value which totally broke the update. I'm sure I'll never make that mistake again.
Here's a screen shot of the result:
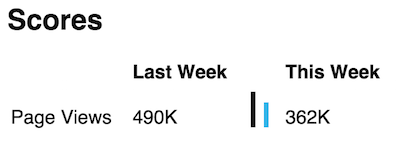
You can see this version in all its glory here: http://www.raymondcamden.com/demos/2015/mar/19/test2.html
So not rocket science, but nice I think. For the hell of it, and because I'm easily amused, I made a third version. I added some range fields to the bottom of the page:
<p>
Last Week: 0 <input type="range" min="0" max="200" value="99" id="leftRange"> 200<br/>
This Week: 0 <input type="range" min="0" max="200" value="32" id="rightRange"> 200<br/>
</p>
I was kinda surprised by how well these are supported now (CanIUse data) but as this version is just for fun, I don't really care about what happens in older browsers. I then wrote a simple event listener for change on them and had them update the data when used.
var BIG_COLOR = "#000";
var SMALL_COLOR = "#3cb4e7";

function renderBar() {
	//get our numbers
	var pv_lw = $("#pageviews_lw").data("raw");
	var pv_tw = $("#pageviews_tw").data("raw");

	var biggest = Math.max(pv_lw, pv_tw);
	var smallest = Math.min(pv_lw, pv_tw);
	//so what perc of biggest is smallest?

	var perc = Math.floor((smallest / biggest)*100);
	//so biggest uses 30, perc determines other
	var smallerBar = Math.floor((perc/100)*30);

	var css_lw, css_nw;
	if(pv_lw == biggest) {
		css_lw = "30px solid "+BIG_COLOR;
		css_nw = smallerBar+"px solid "+SMALL_COLOR;
	} else {
		css_nw = "30px solid "+BIG_COLOR;
		css_lw = smallerBar+"px solid "+SMALL_COLOR;
	}

	$("span#dobar td:first-child div").css("border-top", css_lw);
	$("span#dobar td:last-child div").css("border-top", css_nw);
};

$(document).ready(function() {

	renderBar();

	var $leftRange = $("#leftRange");
	var $rightRange = $("#rightRange");
	var $leftSpan = $("#pageviews_lw");
	var $rightSpan = $("#pageviews_tw");

	$("input[type=range]").on("input", function(e) {
		$leftSpan.text($leftRange.val());
		$leftSpan.data("raw", $leftRange.val());
		$rightSpan.text($rightRange.val());
		$rightSpan.data("raw", $rightRange.val());
		renderBar();
	});

});
You can then play around with the data and see the bars go up and down. Because... I don't know. It's fun.
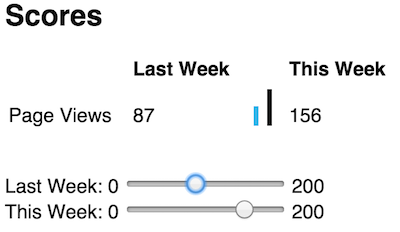
You can test this version here: http://www.raymondcamden.com/demos/2015/mar/19/test3.html