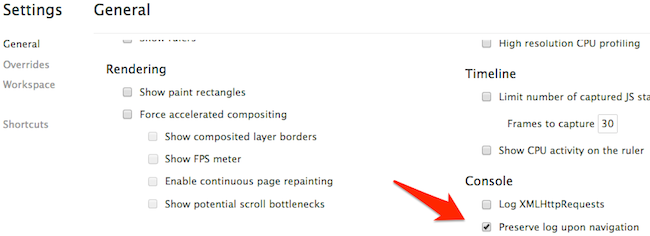
Imagine you have some code that is being fired right before, or during, a click that leads you to another page. If you use the console than you are in luck. Both Chrome and Firefox have options to preserve the console on navigation. In case you've never seen it, here is the option in Chrome. You find this by opening the Dev Tools and clicking the gear icon in the lower right hand corner.
But what about network requests? Chrome does provide you an option to log XHR requests and they will persist if you leave the current page. But you can't get the header information once you leave the page. All you can do is rerun the request. Also, if you are doing anything with JSON/P, it will not be logged here as it isn't an XHR request.
So I mentioned on Twitter that I wish the Network panel had the same feature as the console. Luckily Rich Gilbank (@richgilbank) saw my tweet and pointed out that you certainly could preserve those requests. How? Just click the black circle icon at the bottom.

I had seen that icon before but never clicked on it. Why? Because I assumed it was the "Start CPU Profiling" action you get under profiles. In my own defense, look at the other icons in that area. From what I know, they mostly stay the same no matter where you are in the tools. But in this case, the same icon had a different meaning for the Network tab. (And now I'm going to have to re-check those icons in other tabs as well.)
One small caveat. While the preserved log contains the request and response headers, it does not contain the actual response. There is another option you can consider as well. Add a breakpoint to the action that sends you to another URL. This only works if you are using JavaScript to push the user in the first place. But it would let you pause before you left and see the network requests right before that event.
And of course - there are excellent third party tools like Charles - but in general I try to stick to my browser tools.