After helping a friend earlier this week with a JavaScript issue, I thought I'd quickly write up the normal ways I attack issues with JavaScript. This is not meant to be a definitive guide per se, but just how I go about dealing with problems. I'll be talking about Chrome, but pretty much everything mentioned below is doable in other browsers (some even in IE).
Check for Errors in the Console
First and foremost, I check the console. Normally errors are not shown to users. Consider the follow example:
<script> var x = 1; var y = 2; var z = x+y2; </script>
If I open this up in my browser, I'll see nothing wrong. Obviously if the page tried to display Z I'd see nothing or something unexpected. But there isn't a large error alert, flashing lights, or klaxons. But as soon as I open the console I see:
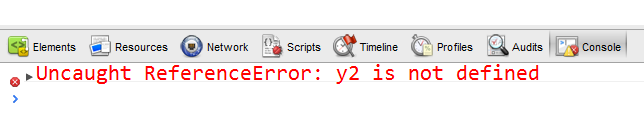
You can even click the line and see the context - which would be real useful in a large file.

What isn't obvious in this screen shot is that Chrome will also highlight the line. Not sure why they fade it out after a few seconds, but it does make it even more obvious.
Check for Errors in the Network Panel
The other big one is the network panel. This shows all network activity and is useful in two ways. One error I see all the time (and this was the error my friend had), was simply not noticing that a library didn't load. This could be because of a web server permission issue or simply forgetting to upload a file! Consider:
<script src="http://2code.jquery.com/jquery-1.6.4.min.js"></script> <script> $(document).ready(function() { console.log("moo"); }); </script>
Notice the bad URL for the jQuery load? In the Network tab, this shows up right away (note, it also creates an error in the console since I tried to use it, but if I was not using jQuery right away, this wouldn't be obvious):
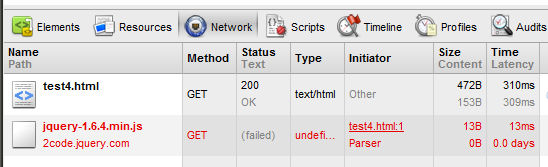
Notice that the Network panel let's you filter. That's recommended if you have a lot of stuff going on, but, you probably want to check everything first. For example, you may be using jQuery UI. If you forget to upload the CSS, things will definitely be wonky, but that wouldn't show up as a missing JavaScript library.
The other big thing to look for here is in the XHR requests area. XHR requests represent your Ajax requests. A full look into this is a bit much for this blog entry, but basically, if you are making an Ajax request for data, you want to check your network request to see what the server returned. Did the server throw an error? Did it return data in a way you didn't expect? Did your result include formatting? For example, many people will wrap all their requests in a template. While this works great for the rest of the site, including a template around your JSON data will break any code that tries to parse it. Don't forget to look at the complete response. You may have whitespace after your JSON that is a bit off screen. You can also right click on an XHR request and open it in a new window to make it clearer.
Finally - one more thing you want to pay attention to is size. If your application is working, but working slowly, look at how big those XHR requests are. Ajax isn't magic. If you return 100K of JSON data it's still going to take time for that data to transfer to the client.
Event Handlers/Selector
This is mainly jQuery based, but could apply anywhere. Another thing I check is my event handlers and jQuery selectors. For example, consider:
$("#mything").on("click", function() { });
If I notice that my click handler isn't running, I check to ensure that #mything is actually matching something in the DOM. In my startup routine I may do something like so:
console.dir($("#mything"));
If I see that jQuery couldn't find it, then I look into my DOM and see what's up. It could be as simple as a typo.
The Debugger
And finally, if all all fails, I try out the debugger. Again, this is a bit too much to cover in detail in this blog post, and, I'm very new to this myself, but the debugger let's you set breakpoints and step through your code. If that doesn't quite make sense to you, consider this - you can pause your JavaScript application and freeze it in time. You can look at variables and their state. You can then have your application proceed one line at a time. It's like God Mode for the browser.
Consider:
<script> var total=0; for (var i = 0; i < 10; i++) { total+=i; } </script>
in Chrome, I added a breakpoint on total+=i, and then added a watch expression (i.e., 'watch this variable') for total. I stepped through the loop a few times and was able to watch the variable increase:

So... that's it - for me anyway. What tips do you guys have?