This came up in an IM conversation earlier today. Given a simple line chart, is it easy to add an average? Here is a quick way to do it. First, I'll start off with an array of data points. A query would work fine as well of course.
<cfset data = [ ["Apples", 50], ["Bananas", 40], ["Cherries", 72], ["Donuts", 59], ["Beers", 91] ]>
Now let's render the data as a series:
<cfchart chartheight="500" chartwidth="500" title="Test Chart"> <cfchartseries type="line" seriesLabel="Sales"> <cfloop index="datum" array="#data#"> <cfchartdata item="#datum[1]#" value="#datum[2]#"> </cfloop> </cfchartseries> </cfchart>
Which gives us:
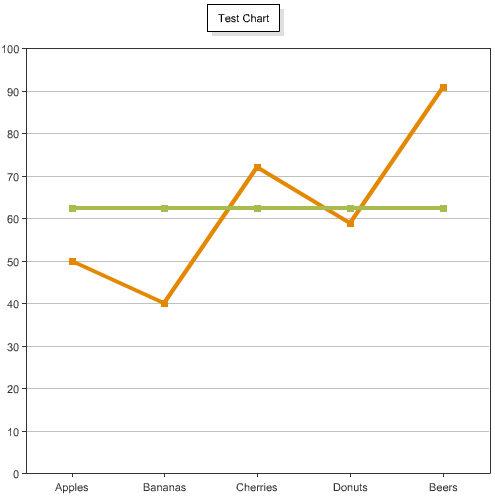
Ok - easy enough. Now let's an add an average. I'm simply going to use a second series for the average. I need to do two things. One - I need to get an average. Since I'm looping over my data points I'll just do some basic math in the first loop. Secondly - I need to output a value for each unit from the first series. The value will be the same - the average - but the item will match up with the items in the first series. Here is the complete code sample.
<cfset data = [ ["Apples", 50], ["Bananas", 40], ["Cherries", 72], ["Donuts", 59], ["Beers", 91] ]> <cfchart chartheight="500" chartwidth="500" title="Test Chart"> <cfchartseries type="line" seriesLabel="Sales"> <cfset total = 0> <cfloop index="datum" array="#data#"> <cfchartdata item="#datum[1]#" value="#datum[2]#"> <cfset total+= datum[2]> </cfloop> </cfchartseries> <cfchartseries type="line" seriesLabel="Average Sales"> <cfset avg = total/arrayLen(data)> <cfloop index="datum" array="#data#"> <cfchartdata item="#datum[1]#" value="#avg#"> </cfloop> </cfchartseries> </cfchart>
Obviously this could be done a bit cleaner, but you get the idea. Here is the result: