A reader hit me up recently with an odd issue using scatter graphs in ColdFusion. Let's take a look at his data and then I'll show you how it rendered.
<cfset getRanks = QueryNew("id, name, rank1, paid_revenue, rank2","integer, varchar, decimal, decimal, decimal")> <cfset temp = QueryAddRow(getRanks, 4)> <cfset temp = QuerySetCell(getRanks, "id", 1, 1)> <cfset temp = QuerySetCell(getRanks, "name", "ft", 1)> <cfset temp = QuerySetCell(getRanks, "rank1", 0.2, 1)> <cfset temp = QuerySetCell(getRanks, "rank2", 25, 1)><cfset temp = QuerySetCell(getRanks, "id", 2, 2)> <cfset temp = QuerySetCell(getRanks, "name", "fg", 2)> <cfset temp = QuerySetCell(getRanks, "rank1", 0.6, 2)> <cfset temp = QuerySetCell(getRanks, "rank2", 2, 2)>
<cfset temp = QuerySetCell(getRanks, "id", 3, 3)> <cfset temp = QuerySetCell(getRanks, "name", "fl", 3)> <cfset temp = QuerySetCell(getRanks, "rank1", 2.5, 3)> <cfset temp = QuerySetCell(getRanks, "rank2", 10, 3)>
<cfset temp = QuerySetCell(getRanks, "id", 4, 4)> <cfset temp = QuerySetCell(getRanks, "name", "fr", 4)> <cfset temp = QuerySetCell(getRanks, "rank1", 0.3, 4)> <cfset temp = QuerySetCell(getRanks, "rank2", 5, 4)>
As just an FYI, you do not need to use a temporary variable for functions that have results. All of those lines could have been changed to:
<cfset querySetCell(....)>Generally I recommend that instead. Anyway - you can see that we have 4 points with 2 numeric values and names in each. Rendering this in CFCHART he used this code:
<cfchart format="flash" chartheight="350" chartwidth="650" showxgridlines="yes" showygridlines="yes" showborder="no" fontsize="10" fontbold="yes" fontitalic="no" yaxistitle="Rank" show3d="no" rotated="no" sortxaxis="no" showlegend="yes" showmarkers="yes"> <cfchartseries type="scatter" markerstyle="circle" query="getRanks" itemcolumn="rank2" valuecolumn="rank1" serieslabel="#getRanks.name#"/> </cfchart>The result is less than optimal:
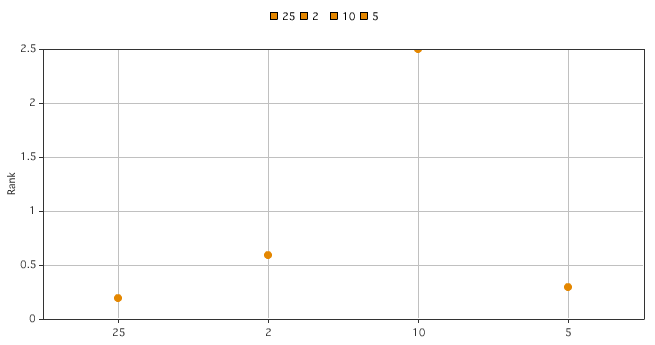
As you can see, ColdFusion rendered the points in the same order as the query, but that doesn't really make sense for a scatter graph. The x-axis should have been rendered in ascending numeric order.
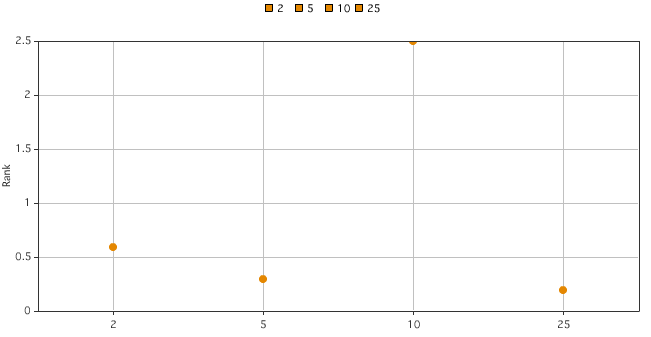
In fact, if you reorder the query with a query of query, it does list the items correctly, but places each point of the x-axis equally apart:
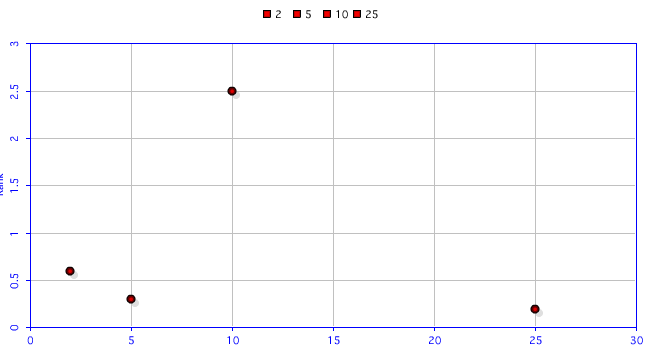
Like I always do, I took a look at the Chart Designer and created a new scatter graph. I didn't do squat to the XML, just used it as is. However, I did modify both the scaleMax value to be appropriate for my data:
<cfsavecontent variable="xml"> <?xml version="1.0" encoding="UTF-8"?> <frameChart is3D="false"> <frame xDepth="2" yDepth="0"/> <xAxis type="Scale" scaleMin="0" scaleMax="30" isBucketed="false"/> <yAxis scaleMin="0" scaleMax="3"> <labelStyle orientation="Vertical"/> </yAxis> <legend> <decoration style="None"/> </legend> <elements shape="Scatter" drawShadow="true"> <movie frameCount="60"/> <morph morph="Grow"/> <series index="0"> <morph morph="Blur"/> </series> <![CDATA[ X: $(colLabel) Y: $(value) Size: $(nextvalue) ]]> </elements> <decoration style="FrameOpened" foreColor="##FF99CC"/> <paint min="47" max="83"/> </frameChart> </cfsavecontent><cfchart format="flash" style="#xml#" chartheight="350" chartwidth="650" showxgridlines="yes" showygridlines="yes" showborder="no" fontsize="10" fontbold="yes" fontitalic="no" yaxistitle="Rank" show3d="no" rotated="no" sortxaxis="no" showlegend="yes" showmarkers="yes"> <cfchartseries type="scatter" markerstyle="circle" query="getRanks" itemcolumn="rank2" valuecolumn="rank1" serieslabel="#getRanks.name#"/> </cfchart>
The result is significantly better (in my opinion):
Nice - but unfortunately, there is no way to label the points, which was another request from the reader. ColdFusion only allows you to pass pure chart data for the points. You can't supply additional data to be used by the labels. Of course, there are alternatives. The XML/SWF Charts library has a nice scatter example. Ditto for Google Charts (although I didn't confirm if you could label each data point).